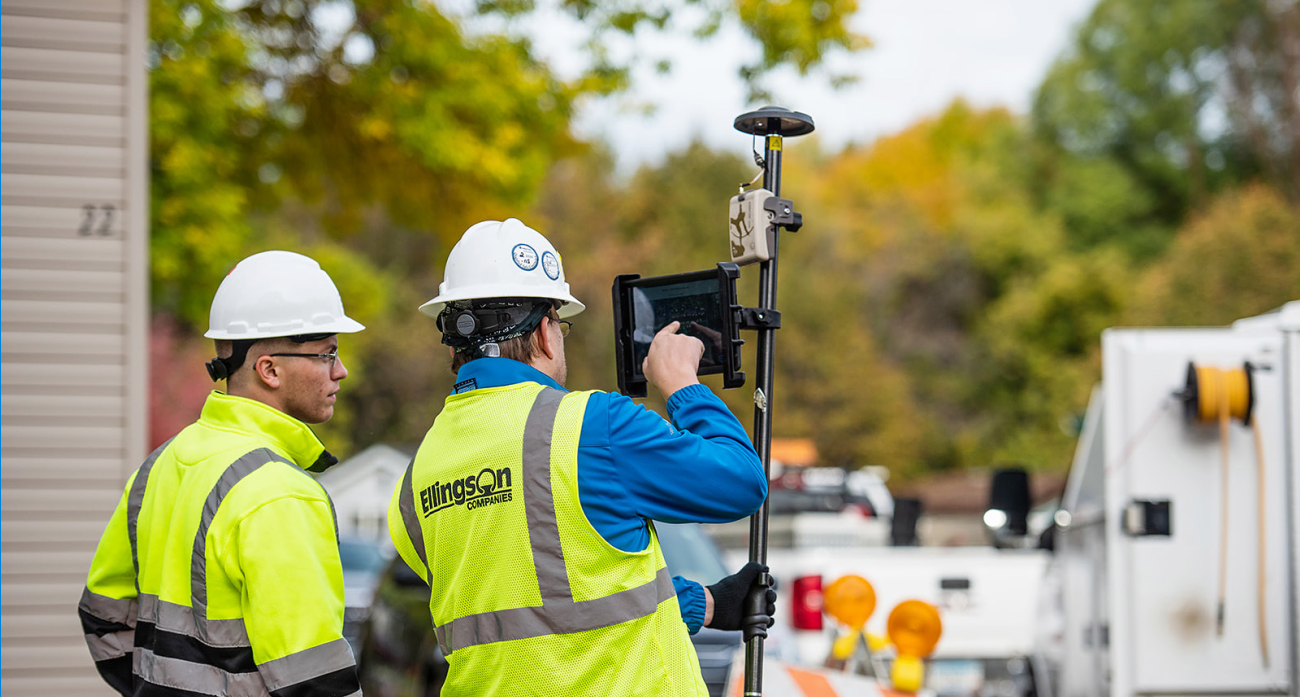
Minnesota’s Ellingson Companies Provides Gas Utilities with High-Accuracy, Real-Time As-Builts that Comply with Industry Standards
In 2019, Minnesota-based utility consultancy Ellingson Companies was asked to deliver the first of what would become many similar projects: How do you collect data for new pipeline construction in real time, with extremely high accuracy, without any human error, in particularly rugged conditions, with the help of a field crew that was used to using paper notetaking?
In this 2022 Esri User Conference (UC) presentation, Ellingson Companies GIS Manager Damon Nelton presents how his company did just that. By leveraging software and solutions from global provider Esri® and Canadian hardware manufacturer Eos Positioning Systems, Nelton was able to develop a solution that allowed his team to capture new pipe construction within 0.25 inches of accuracy. The solution also improved field productivity, especially through streamlined documentation workflows, and allowed Ellingson Companies to provide its gas utility clients with digital as-builts that not only met the client’s needs, but allows future stakeholders to make safer, more informed decisions.
Keep reading the transcript below, or watch the full presentation to learn how they took advantage of technologies including: ArcGIS apps, high-accuracy Eos Arrow Series® GNSS receivers, barcode scanners, tracking and traceability workflows, enterprise geodatabases, dynamic PDF customer reports, dashboards, and more.
Watch the Full Esri UC Session
Short Video Recap
Read the Full Transcript: Introduction
Thank you, I’m Damon, and I’m with Ellingson Companies out of southern Minnesota. We’re a construction company, so we don’t actually own any utilities, but we pride ourselves in taking advantage of the latest technologies for all underground pipe projects that we work on in several different sectors.

Today, we’re going to focus on the gas utility distribution sector. So, we’re going to start by talking about, “What was the challenge to overcome to begin with? Why change what we’re doing?” And what I’m going to be talking to you about is how we changed our documentation when we put new installation into the ground.
We’re going to learn a little bit about tracking, traceability, and Esri’s Utility and Pipeline Data Model (UPDM). You’re probably all experts on it, but we’ve got a little bit of briefing on that. And then we’re going to get into what it actually took to put all the cool pieces of GIS together to build the workflow.
And lastly, I’ll go over some of the results from some of our first projects. I’ll talk about some lessons learned and some things that we’re hoping to improve upon going forward.
The Challenge: Why Reinvent the Wheel?

So, if it’s not broke, why fix it? That’s what every crew member is going to tell me. We’ve been putting pipe in the ground for generations and decades. We send the client a bill. Bill sends us payment. People in their houses get heat in the winter. What’s the problem, right?
Challenge #1: Delivering High-Accuracy Data in Real Time
Well, it’s twofold. One, a few years back, I had a salesman who went to a meeting with a utility company and came back and said, “Guess what, Damon? They’re going to pay us to put pipe in the ground and they want you to do your GIS stuff. Can you digitally map it live in the field?” Sure. We’ve done it before. We’ll figure it out, right? And so that’s where the fun is.
Challenge #2: Preventing Utility Hits to Increase Safety
Utility hits are important and, every year, there’s more of them being done because people don’t really know where things are. In 2019 in Minnesota, there were over 4,000 hits, of which about half involved gas [utility infrastructure].
The second problem is, is that utility hits are a really big deal. Every year, year after year, there’s more of them being done because people don’t really know where things are. In 2019 in Minnesota, where I’m from, there were over 4,000 hits, of which about half of them involved gas [utility infrastructure]. So not only are we trying to look for efficiencies on coming in at budget or under times without delays, but it’s also the safety aspect: knowing that in future projects going forward, everybody’s going to get to go home.
There’s got to be a better way, right? I mean, right now, this is how we know where things are: we call a guy, he comes out with a can of spray paint. Hopefully it’s not white in the winter. Then, switch to pink.

And if our operator knows Morse code, with a little bit of luck, we can sometimes figure out where utilities may or may not be.
Discovering and Implementing the Utility Pipeline Data Model
So, working with the utility companies, I wanted to incorporate a digital as-builting capability that was going to satisfy our need for how we do things in our divisions, but also their [the client’s] needs. And they told me something about this Utility Pipeline Data Model that I had not been familiar with at the time, and the utility pipeline feature layer set. So, I did a little Googling, and by coincidental dumb luck, I find a guy named Tom DeWitte, who works with Esri. And, I emailed him.
I said, “Tom, you seem to know about this Utility Pipeline Data Model. What can you tell me?” And he emailed me back and said, “Wouldn’t you know it, I’m only about an hour from your office. Why don’t you come on up? I’ve been working on a white paper for tracking and traceability.”

And so, what I learned was that in 2015, the Pipeline and Hazardous Materials Safety Administration (PHMSA) got together and proposed some new rules to address the need for operators to better track the details and the location of assets after the delivery from the manufacturer.
And the rule also spoke for the need to better traceability of assets, meaning the ability to locate them by material, diameter, lot number, manufacturer dates and other attributes. And so with that, we decided to use the data model. And what it is, if you guys aren’t familiar with it, it’s a feature data set with a bunch of layers. And these layers have attribute tables that are miles and miles long. It’s a one size fits all.
Reinventing the Wheel: Building out the Workflow to Comply with PHMSA Standards
So, when we work with our clients, we don’t tend to use every single attribute table, but we work with them to identify which ones they need to track for their operations in their system. And we get that list down and then we work on setting up a schema for default values — you know, project numbers, dates, things like that. And then also pick lists.

Now, the goal is to get the best data integrity possible so that there’s less human error — to take the human out of the equation whenever possible. One of the ways that this is happening is that part of this 2015 revelation of a better way to do it was that the [American Society for Testing and Materials] ASTM standard created a 16-digit alphanumeric caps-sensitive bar code, that all the plastic component pipe manufacturers are going to use, that when parsed properly can give you thickness, diameter, lot number, manufacturer date — seven attributes in total that our guys would have to write on a piece of paper normally.
And someone at some point would have to actually try to read what they wrote. So, by using scanners on just our simple iPad® [devices] and phones, we are able to scan barcodes that will then use the attribute rules from this database that, I forgot to mention, needs to be set up in an ArcGIS Enterprise geodatabase.
And I say that like it’s nothing. But for a lot of GIS teams, that’s not a nothing, you know? Enterprise geodatabases don’t magically create themselves, and if you’re not used to using them, there’s a learning curve on that itself. And there’s probably classes in this conference where you could spend the whole class learning about how to manage and set up those. Really, everything I’m about to tell you is impossible to squeeze into 15 minutes. So, if you have follow-up questions, let me know. We’re going to cover a lot of ground here.
Shooting Gas Meters in Obstructed Areas with Eos Laser Mapping™ for ArcGIS
For shooting the gas meters, that’s a little trickier, right? They’re typically under trees, under the eaves of a roof, next to a two-story building, et. cetera. And so, you have to shoot them with offsets. The Eos Laser Mapping™ for ArcGIS solution allows you to use a laser attached to your range pole that feeds data directly into your GIS.
You can shoot your point in the middle of the street, get your accuracy, move over, shoot the laser at the gas meter, move over, shoot your point again — and then it triangulates it so that you can still maintain that accuracy level that you would want, even if you’re standing right next to the building, not talking to satellites as well. There’s a lot of trial-and-error learning on how to best go shoot points if that’s not something you’re used to doing.
With Field Maps, our guys would simply press the plus button, right? And they’d say, “I am going to drop an excess flow valve right here, a meter riser, a tee [fitting], a MetFit coupler.” They go through the predefined pick list that we set up and they’d enter. Maybe on any given project, [there’d be] five or 10 different fields at most by hand.
But then they’d scan that barcode — we’ll talk about barcodes later and lessons learned; basically don’t take it for granted how easy it is to scan a barcode — and that’ll auto-populate another seven attribute fields.
Obtaining High-Accuracy with RTK Networks and Atlas®
In the middle of the mountains, six inches is pretty darn good.
With the Eos unit, we’re tapping into RTK networks. So, in Minnesota, we’re fortunate we have a free one with MnCOORS. Some of the other surrounding states have free ones. We also do projects out like in the Black Hills where there’s not an RTK network. Eos also provides a [paid] service called Atlas® [for areas like this]. It’s [got] a monthly subscription fee. But with that one, you can maintain approximately four to six inches of accuracy without a true RTK network using their Atlas satellite constellation. In the middle of the mountains, six inches is pretty darn good. It’s within a bucket scoop.
Simple Surveying with Survey123 Forms
And then after the crew goes in and shoots all their services, within the feature itself we configure the pop up to have a link to open up a survey in ArcGIS Survey123. Then, the foreman can click on this, to put in his inspection notes and other information. [Survey123 forms are good for when they need to input information] that I don’t always fully understand, but I know is important to the project and, you know, isn’t as simple as shoot and click.
And with all that data being captured like that, we can create really awesome dashboards and web apps essentially live from the field, and assuming they have online capabilities and that we don’t have to build it for offline, the data will come right back to the office. And not only our office, but also — if the utility network division that we’re working with has a GIS team with their own ArcGIS portal or online capabilities — we’ll set up a collaboration with them so that when this data is getting entered in the field, it’s actually going into layers that are shared between divisions.
So, when the service on 10th Street goes active at 10 a.m., the utility department knows about it at 10 a.m. Not 10 a.m. three months from now, as guys are scrounging up pieces of paper to turn in at the end of the project.
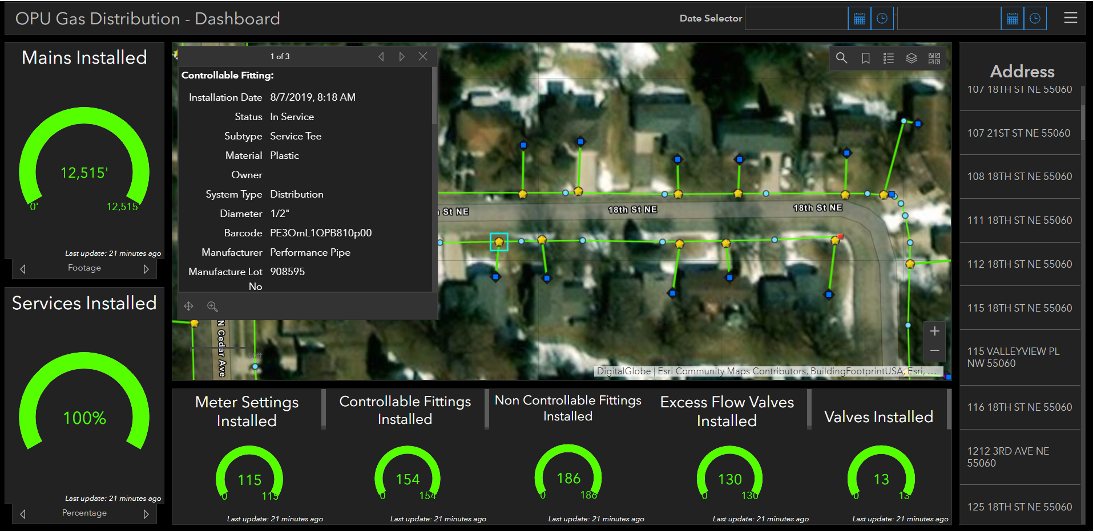
So, when the service on 10th Street goes active at 10 a.m., the utility department knows about it at 10 a.m. Not 10 a.m. three months from now, as guys are scrounging up pieces of paper to turn in at the end of the project.
It’s a big deal.
Streamlining Paper Forms with PDF Templates in ArcGIS Pro
But cool dashboards are not always enough. Undoubtedly, every utility company that I’ve worked with so far has somebody who really likes paper and nothing makes them feel more happy than going to the printer and picking up that piece of paper, sniffing it, walking through the filing cabinet, putting it in there, never to be seen again and resting assured that it was done good. So, to overcome that, we had to come up with some creative solutions.
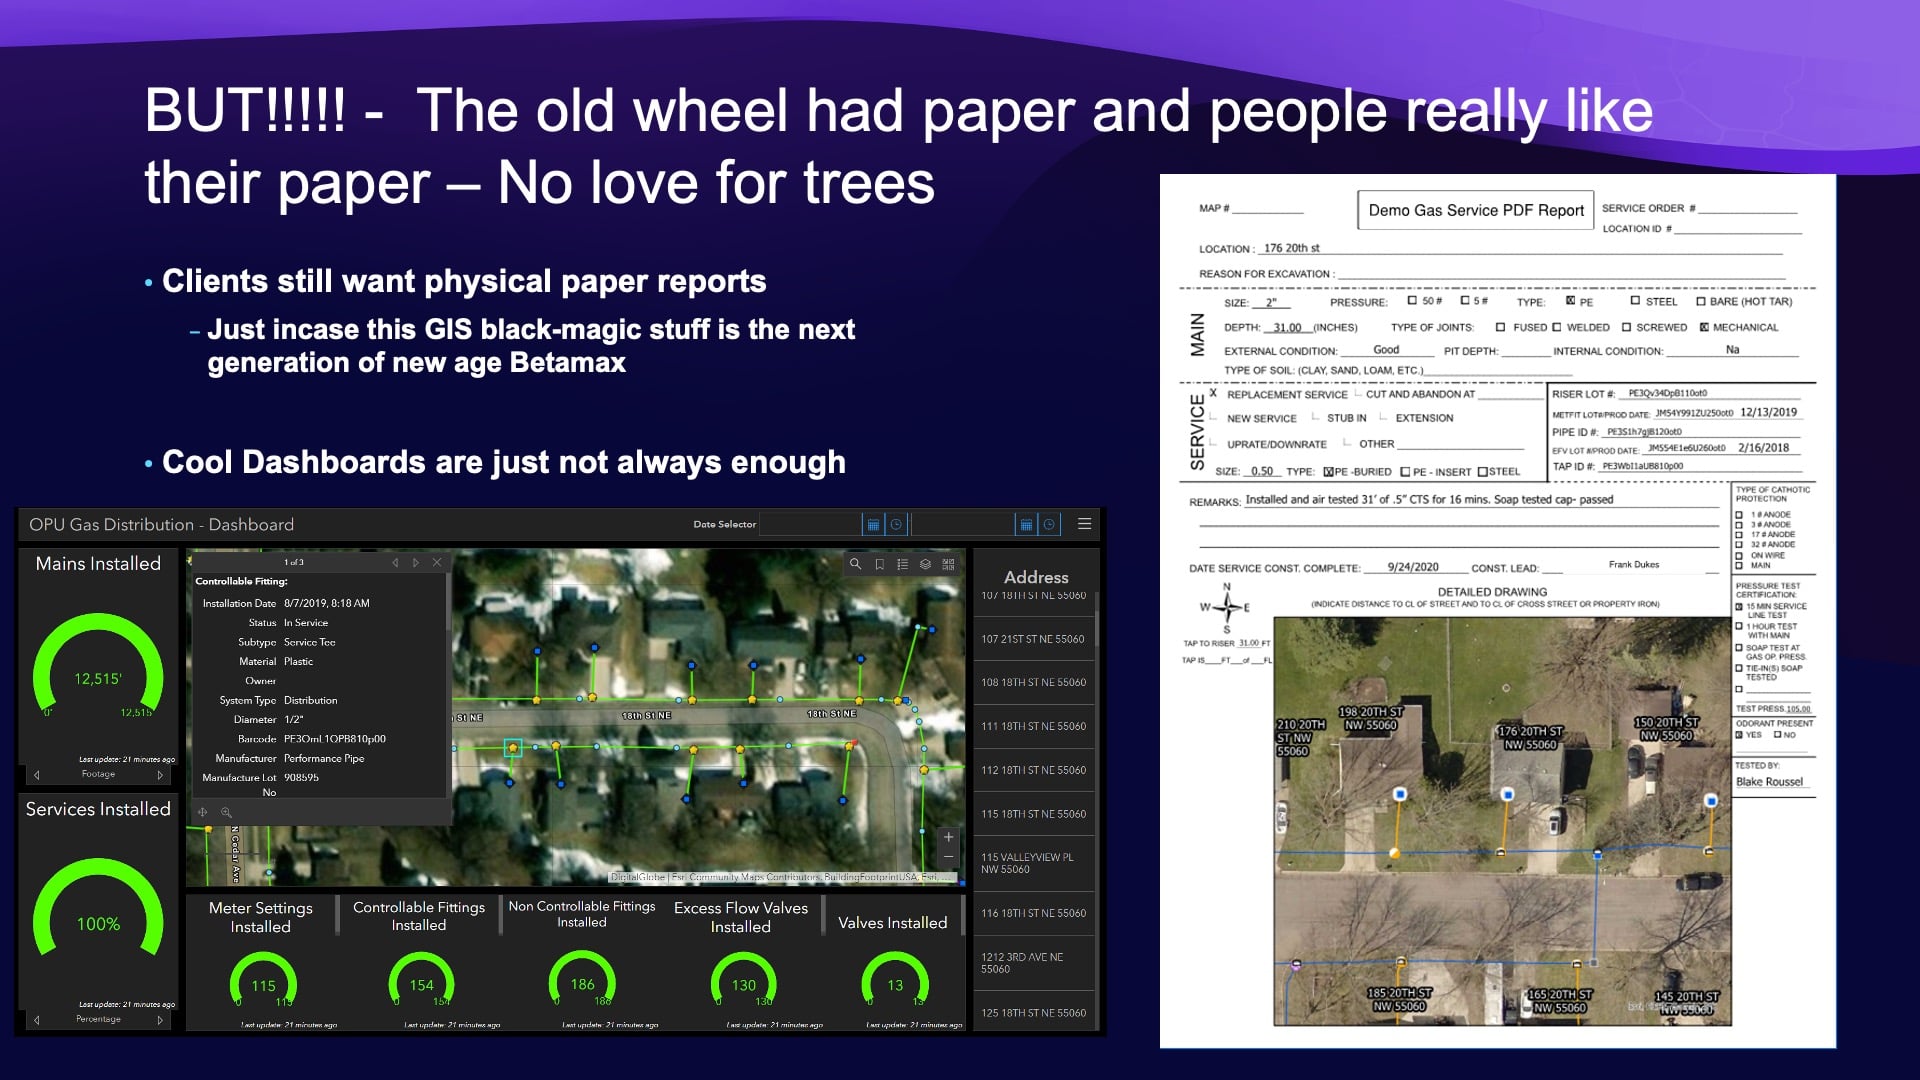
We tried a handful of things and what we settled on was creating a Microsoft Word doc template of the customer’s format. And every customer has different formats of their letterhead and however else they want to do it. And then using dynamic text with syntax in ArcGIS Pro, it can grab the data from all the different layers that are being populated from the crew in real time and actually start filling in this PDF and having the map center on where the specific service asset is. And then with a little bit of black magic, we can then export it out as a PDF and attach it to the service feature.
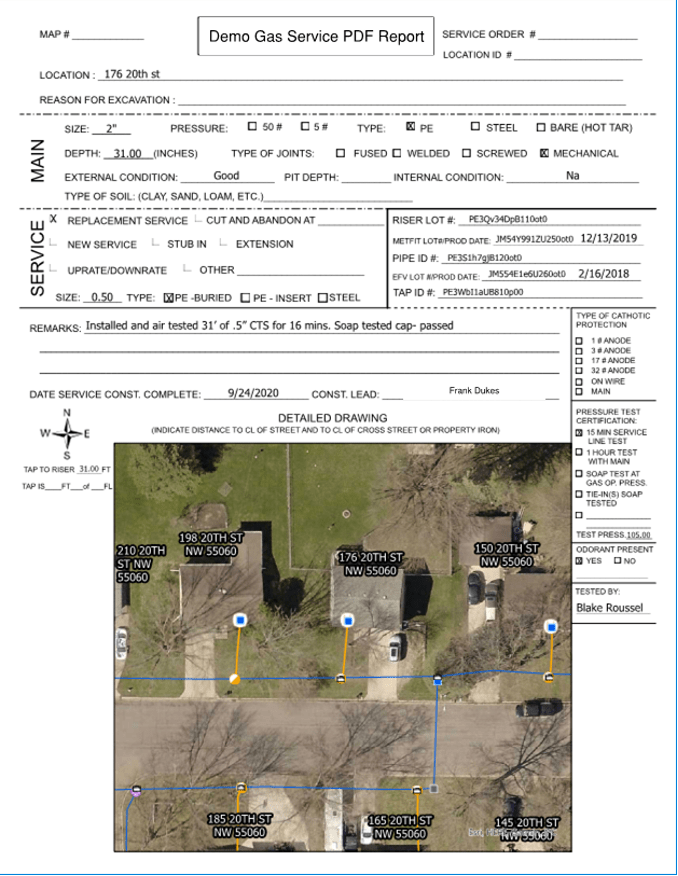
So now the guy who needs that PDF can click on every single service in real time as it’s being populated, and if he chooses, print a piece of paper and put it in his filing cabinet. We were going to use Survey123 to do the reporting thing, but we ran into limitations with how good we could get the map to look. And also limitations on gathering data from multiple different layers and bringing them together into one report that, you know, maybe not all that was in a single server.
The Results: Highly Accurate, Real-Time, Collaborative Data
So, the result is a really cool, shiny new tire, right? We had roughly 2,400 features on this project that we shot in with our GNSS receivers, with the Arrow Gold. We averaged 0.25-inch accuracy throughout the entire project. We did spot checks with other survey equipment and with the city’s survey team to confirm that, you know, that we were good — like I said we use RTK networks.

“This is a Big Deal”: Reducing Human Errors and Increasing Efficiency with Digitized Data
At the end of the project, then, we got almost 17,000 digits with no human entry other than pressing the button on the barcode scanner, which means zero data errors.
We had to find all 23,000 or so attributes, not counting the 36,000 auto-populated GPS attributes by simply checking the “enable metadata for GPS” box when you create a layer [in ArcGIS]. These attributes, over a thousand of them, were these 16-digit caps-sensitive alphanumeric ones, right? And on these reports, you’re going to see riser layer, riser lot, MetFit companies, pipe, tap — every single component has one of these 16-digit numbers, and you can actually read them. And no one wrote them down.
We took the human part out of it, right? And that’s a big deal. Because at the end of the project, we got almost 17,000 digits with no human entry other than pressing the button on the barcode scanner, which means zero data errors. And maybe the coolest part about this new workflow is that at the end of the project, when the guys left the job site after putting their last piece into the ground, they walked away and we were done.
I call the utility company and say, “We’re done.” They say, “Great, looks like we have all your data. Hope to do work with you next time.” I don’t know about you guys, but this is a big deal, right?
I’ve heard rumors in the past, prior to this workflow, that occasionally these pieces of paper that they’d fill out in the field would end up in glove departments, the dog would eat a few of them — they’d misplace them. And months after the project, after the customer would pester us enough, guys might go into a room and try to retro-fill all kinds of paperwork on where the assets are and what they put in the ground — and all these different specs. And they were spot on after three months and five projects ago. Their memory is like a steel vault.
This is a big deal.
Lessons Learned: Breakthrough is Worth Facing Challenges
You know, as we implemented this [project], it was not without its challenges. It seemed like every step we built, you know, we had to overcome something. I have a spot on my wall that says, “Bang your head here.” That’s why I’m bald. But after so much banging, when you break through, then it’s like the rush of, you know, success.
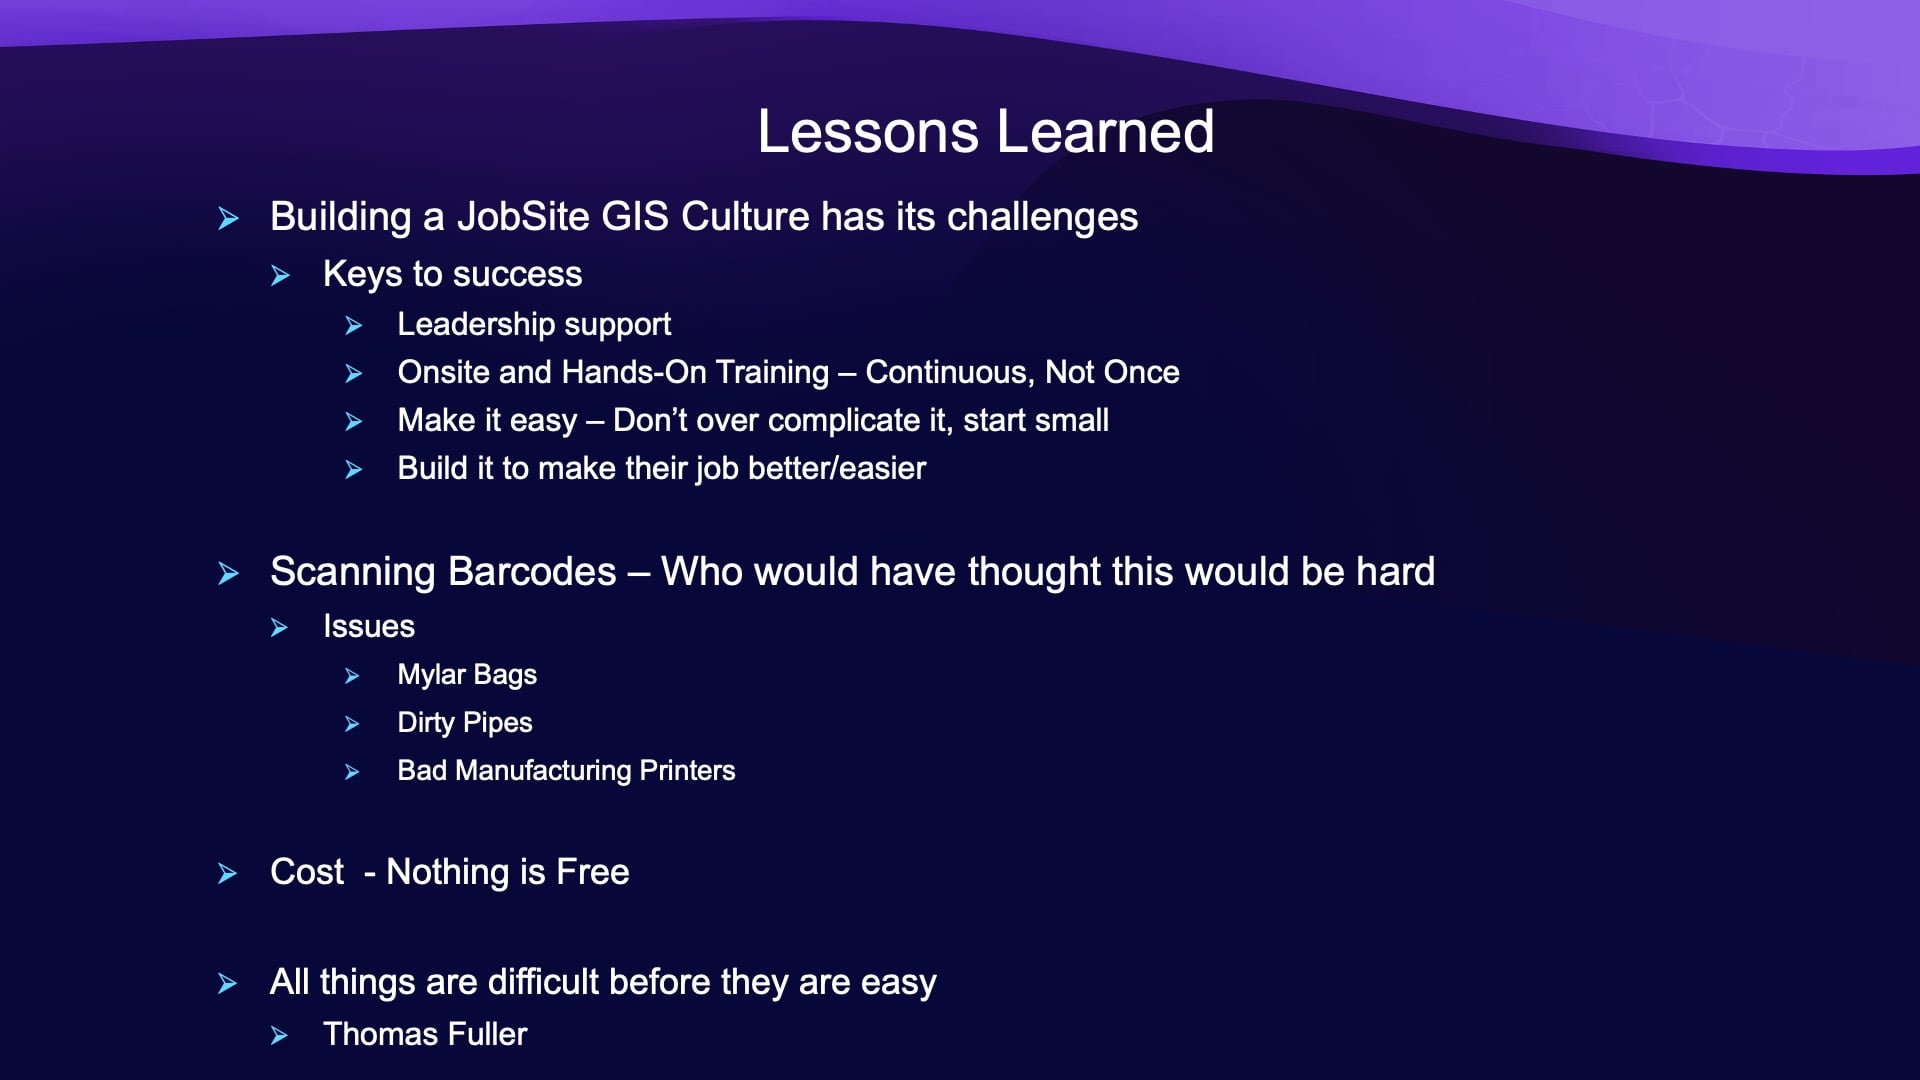
But the real big key is support from leadership. You know, as GIS professionals, we can’t be the bad cop. We have to be the good cop. We’ve got to be the people that go to the job site with a pizza just to make sure everything’s working well. We have to have the leadership to enforce it and to make sure that they’re promoting it to be used, because [a new workflow like this] is a culture change. And I do got guys on my crew with hands like stone claws who break three iPads a week because, you know, they’re not good at pressing buttons.
Prioritizing Training: A Continuous Effort
It’s a continuous thing until it becomes the new norm, until it becomes where the guys on the crew get used to it and understand that they like going to the hotel at the end of the day and not having any paperwork to do, because they already did it live in the field.
Training is not a one-time, you know, come to my class and maybe you show up, maybe you don’t. It’s a continuous thing until it becomes the new norm, until it becomes where the guys on the crew get used to it and understand that they like going to the hotel at the end of the day and not having any paperwork to do, because they already did it live in the field. To where now, they’re asking for this [solution] on their projects, and they don’t want to go back [to the old ways] after they understand that not collecting data isn’t an option. The option is, do you want to go with paper, or do you want to go digital? We’re telling you that you need to go digital, but not collecting isn’t an option. Once you get that through their heads, then they realize that they actually like whipping out their phone and pressing a few numbers better than they like doing paperwork in the hotel.
Mud is Thick, Barcode Scanners Sound Easy, and Keeping Things Simple Helps
Scanning barcodes, like I said, sounds simple enough. I have tried out both cheap barcode scanners and multi-thousand-dollar barcode scanners. When the Mylar® bag has a printing error from the manufacturer, it doesn’t matter what kind of scanner you have — it will not scan it. Yellow plastic pipe with nice fancy barcodes? They get wiped off with your thumb, or dirt, or mud. And the mud on job sites, for any of you haven’t been to job sites, is like peanut butter. I mean, it is thick. I helped develop this workflow in the very beginning. I was out there every day and I had to spend about 15 minutes after every shift with a stick and my boots cleaning the mud out of them, out of my boots before getting in my car.
So, what we came up with was, I went old school. I said, “Keep it simple, stupid.” Right? I got keyrings and I did an inventory assessment at the utilities warehouse before the project started. I took pictures of all the different components that were going to be part of the project and got all the barcodes off of them. And I made my own barcodes onto flashcards that were color coded by the different asset types. So, if there was a fitting for a tee, or a service main, I then put them on a keyring and laminated them.
So that way, it’s twofold right? The barcode worked and scanned, but they also didn’t have to scan difficult barcodes. When they’re shooting a point, trying to get the range pole right on top of the tee and the hole is huge, they don’t have to get down in the bottom and try to get that sticker they’re scanning. They just flip through the flashcards, scan the barcode and life goes on. It’s not perfect, but it actually works pretty good.
Confidence in Locations Pays off in the Long Run
And then there’s the cost. You know, nothing’s free, right? So sometimes we can do a project where I have a foreman who has got really good head on their shoulders, and they can go through this without any help.
Other projects need a friend, a college intern to help with this data collection and go pick up things at Home Depot when they’re missing. And there’s the cost of, you know, setting up the project and maintenance for it.
And so, some of these bids that go out for gas distribution work are really, really competitive and the customers aren’t quite on board yet. But I think it’s going to be changing soon that, you know, this is something worth paying for.
It’s not just the value added now, it’s the value added on every project going forward when they know within a 0.25-inch accuracy where the excess flow valve is. And then I’ll leave you guys with this. This is a wise man gave me this saying, and I couldn’t agree with it more; “All things are difficult before they are easy.”
And this couldn’t have been truer. This is a super fun workflow now, that we enjoy doing. But right out of the gate, there was a lot of head banging. And that’s where we leave it. Thank you.
Download a PDF of this case study in ENGLISH.
Would You Like to See an Eos Customer Presentation?
Subscribe to our monthly newsletter for information on where our customers are presenting next.

