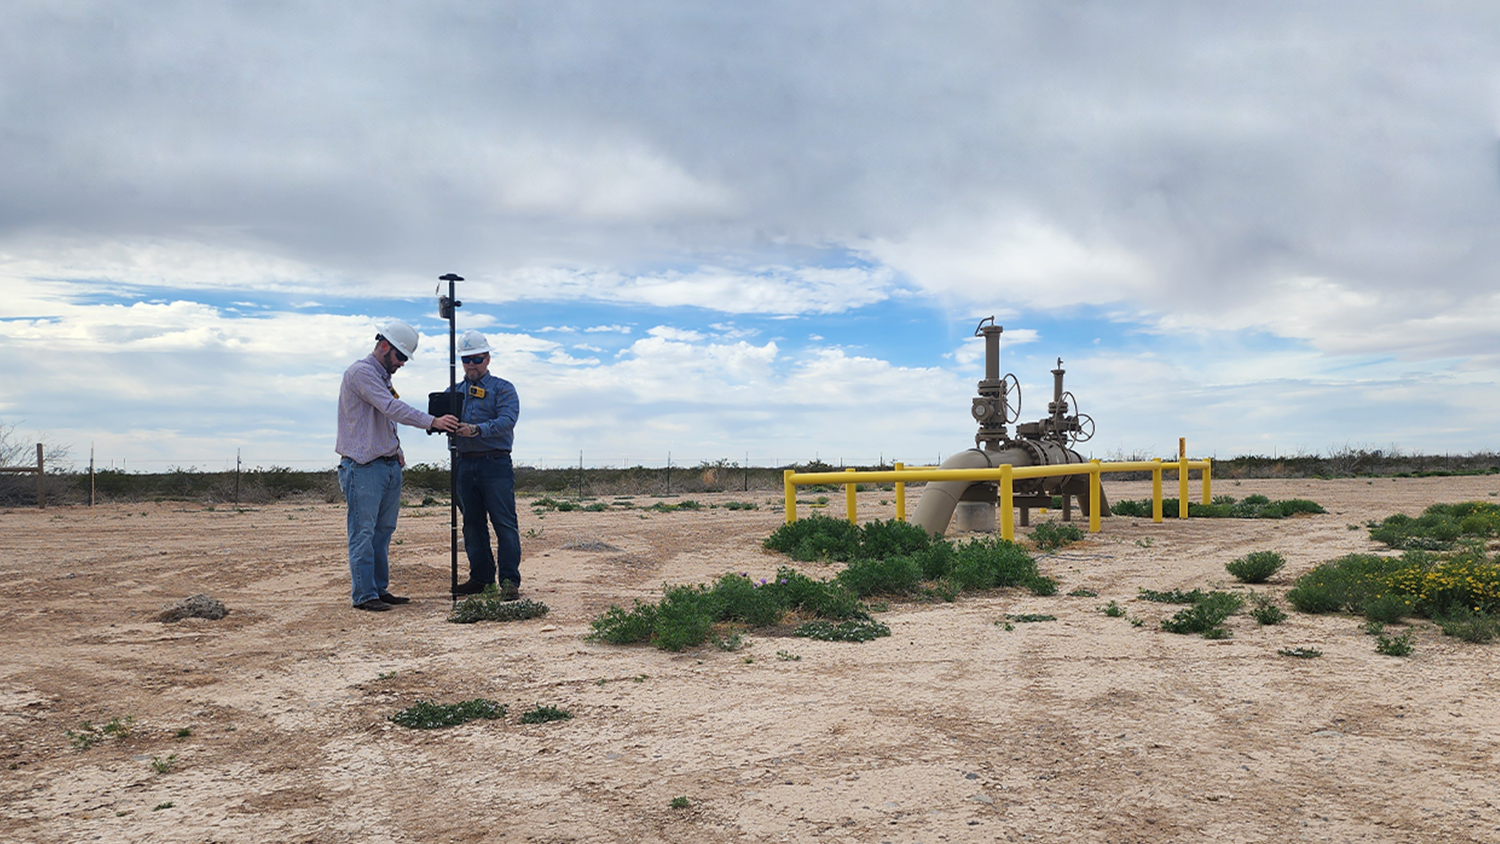
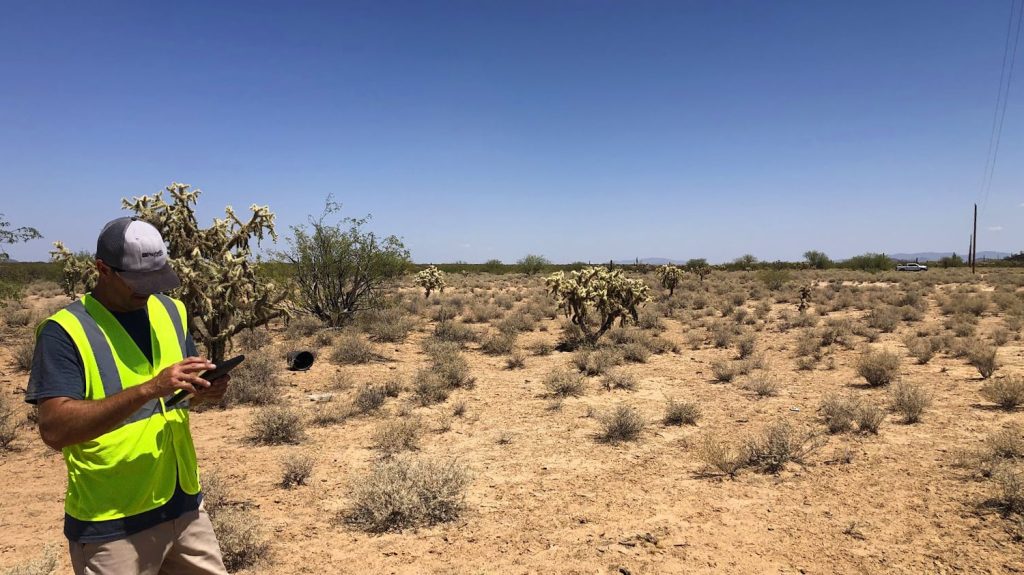
The large Texas midstream pipeline operator reconciled and field-verified numerous asset records from over a decade of acquisitions

Today, Kinetik operates over 2,000 miles of natural gas, natural gas liquids, crude oil, and produced water pipelines and has a workforce of over 300 dedicated employees. Yet just over a decade ago, the company’s humble beginnings involved “just four guys and a truck” who secured their first sales agreements by utilizing third-party maps. Over the past 10 years, Kinetik has grown into one of the largest midstream providers in the Delaware Basin, largely due to multiple strategic acquisitions.
Growth through acquisitions presents unique challenges, one of which is the sizable task of identifying, reconciling, and consolidating diverse pipeline database records. Kinetik therefore recognized the importance of consolidating these diverse records into a single database and took on a systematic approach to develop its own in-house geographic information system (GIS). As the company continued to acquire assets and grow, Kinetik enlisted the expertise of industry specialist Papillon Romero as their full-time GIS Manager in late 2021. With an impressive background in pipeline GIS and experience with global projects from diverse corners of the world, such as Qatar and Kuwait, Romero was the perfect fit for the task.
Romero was aware an efficient and reliable GIS database is essential for a growing organization such as Kinetik. He immediately began reviewing the company’s geospatial records.
“GIS should be the backbone of an organization like ours, a system of record,” Romero said. Understanding the value of a well utilized GIS, he recognized an opportunity to transform Kinetik’s legacy system and developed a strategy to elevate it to new heights.
Video Recap
The Challenge: A Decade of Diverse Databases
Romero enlisted the support of Esri business partner Full Circle GIS, a Missouri-based consultancy led by Principal Consultant and Data Architect Camron Hull. Together, Romero and Hull established three goals:
- Build a comprehensive and reliable GIS on which all employees could rely.
- Accelerate the movement of data from field to office, so staff could operate more safely and efficiently based on the most recent data.
- Empower field technicians with a simple and accurate data-collection tool that would enable them to efficiently identify, and contribute to the update of, any inaccuracies in the GIS data.
With support from leadership, they set to work.
The Approach: The DMs of Pipeline Management (Data Modeling, Data Migration, Data Management)
Romero and Hull migrated off the company’s legacy desktop GIS onto ArcGIS® Pro. This would provide the needed tools for the company’s data-model overhaul and migration. Recognizing that the legacy data model was overly complex for Kinetik’s needs, Romero and Hull chose to migrate to the Pipeline Open Data Standard (PODS) data model. Specifically, the PODS7 data model was identified as better suited to Kinetik’s midstream operations.
Before migrating, though, they wanted to ensure moving only high-quality data. That meant a process to reconcile a decade of acquired disparate data.
Romero and Hull sifted through numerous, varied datasets to establish a single, plausible centerline database. They removed assets from the GIS that were no longer in-service and added assets to the GIS that were missing from digital records. They also verified the status of assets, such as those previously marked as “inactive” but which were still in the field, ensuring accurate mapping and milage for compliance and project bids.
“We did a lot of work to determine the most complete centerline file we could find,” Hull said. “Then we knew we had to get out to the field.”
The Solution: “Pigging” the Right Field Tools
Kinetik’s field technicians play a crucial role in the company’s operations, and Romero and Hull were surprised when they discovered that most field technicians were not regularly accessing the GIS database. In fact, all of Kinetik’s 1,000 weekly GIS views came through the company’s legacy ArcGIS desktop software.
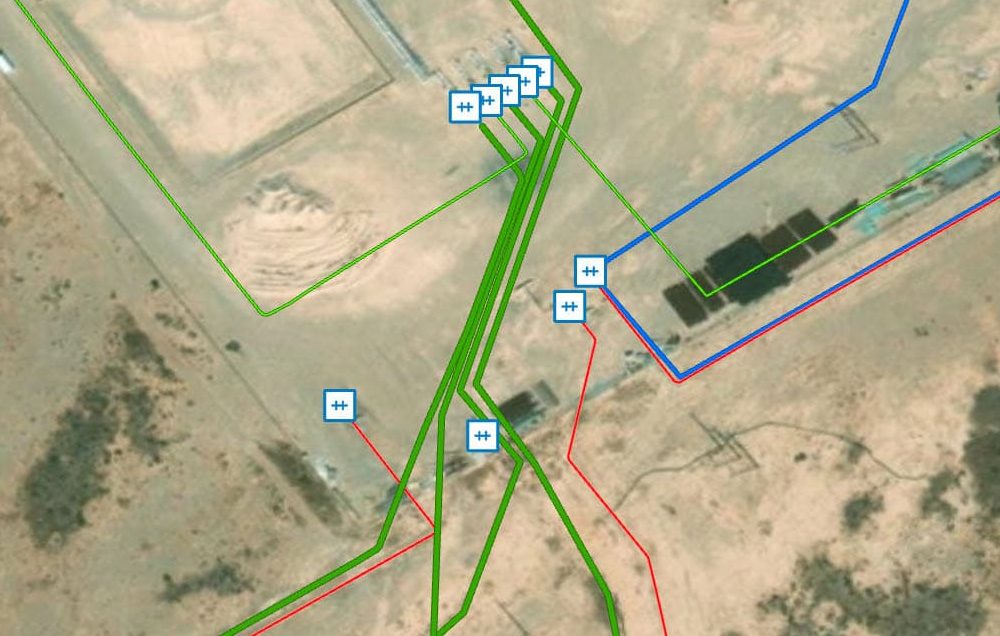
When initially introducing ArcGIS Pro, Romero recalled one of his weekly meetings on pipeline integrity gauges (PIGs). PIGs are tools used to ensure compliance with maximum allowable operating pressure (MAOP) regulations. In this meeting, a pigging technician pointed out that a particular pipeline’s linear representation on the map did not accurately reflect a bend it made. There were also two pig launchers that were not displayed.
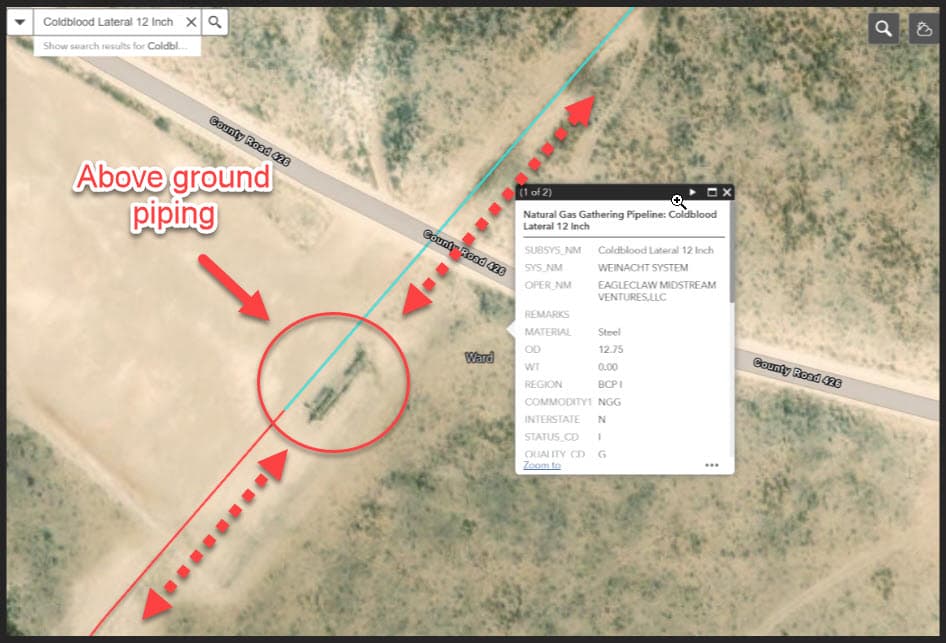
Understanding that the pipeline changed diameter at this location because there were two launchers in the imagery meant that one pigging tool could not be used in this pipeline, which would require a contractor to bring a different size of pigging equipment or schedule a separate scheduled pigging run of the tool.
“The guys in the field knew there were launchers there, but according to the GIS in the office, the pipeline looked like it went straight through without any transformation,” Romero said. “We needed to know how the diameter changed right there so the company coming in to pig for us had the right-sized tool.”
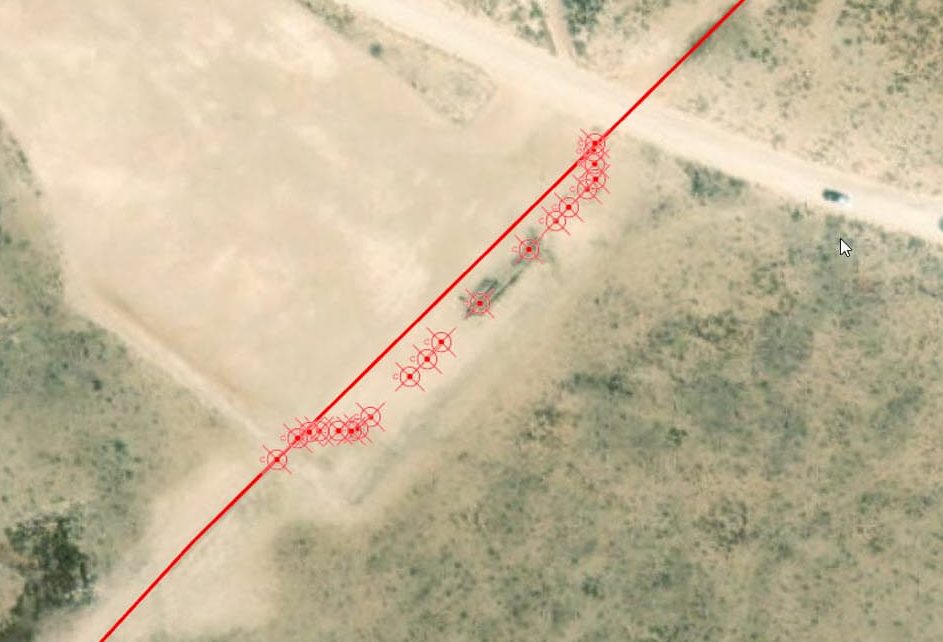
This discrepancy led to the realization that the company’s field technicians – the individuals that are intimately familiar with these assets – needed an easily accessible, user-friendly solution to access and update critical GIS data in the field. Romero recalled the technician asking, “Is there a way I can just update this on my phone?”
ArcGIS Field Maps for Quick, Standardized Field Data Collection
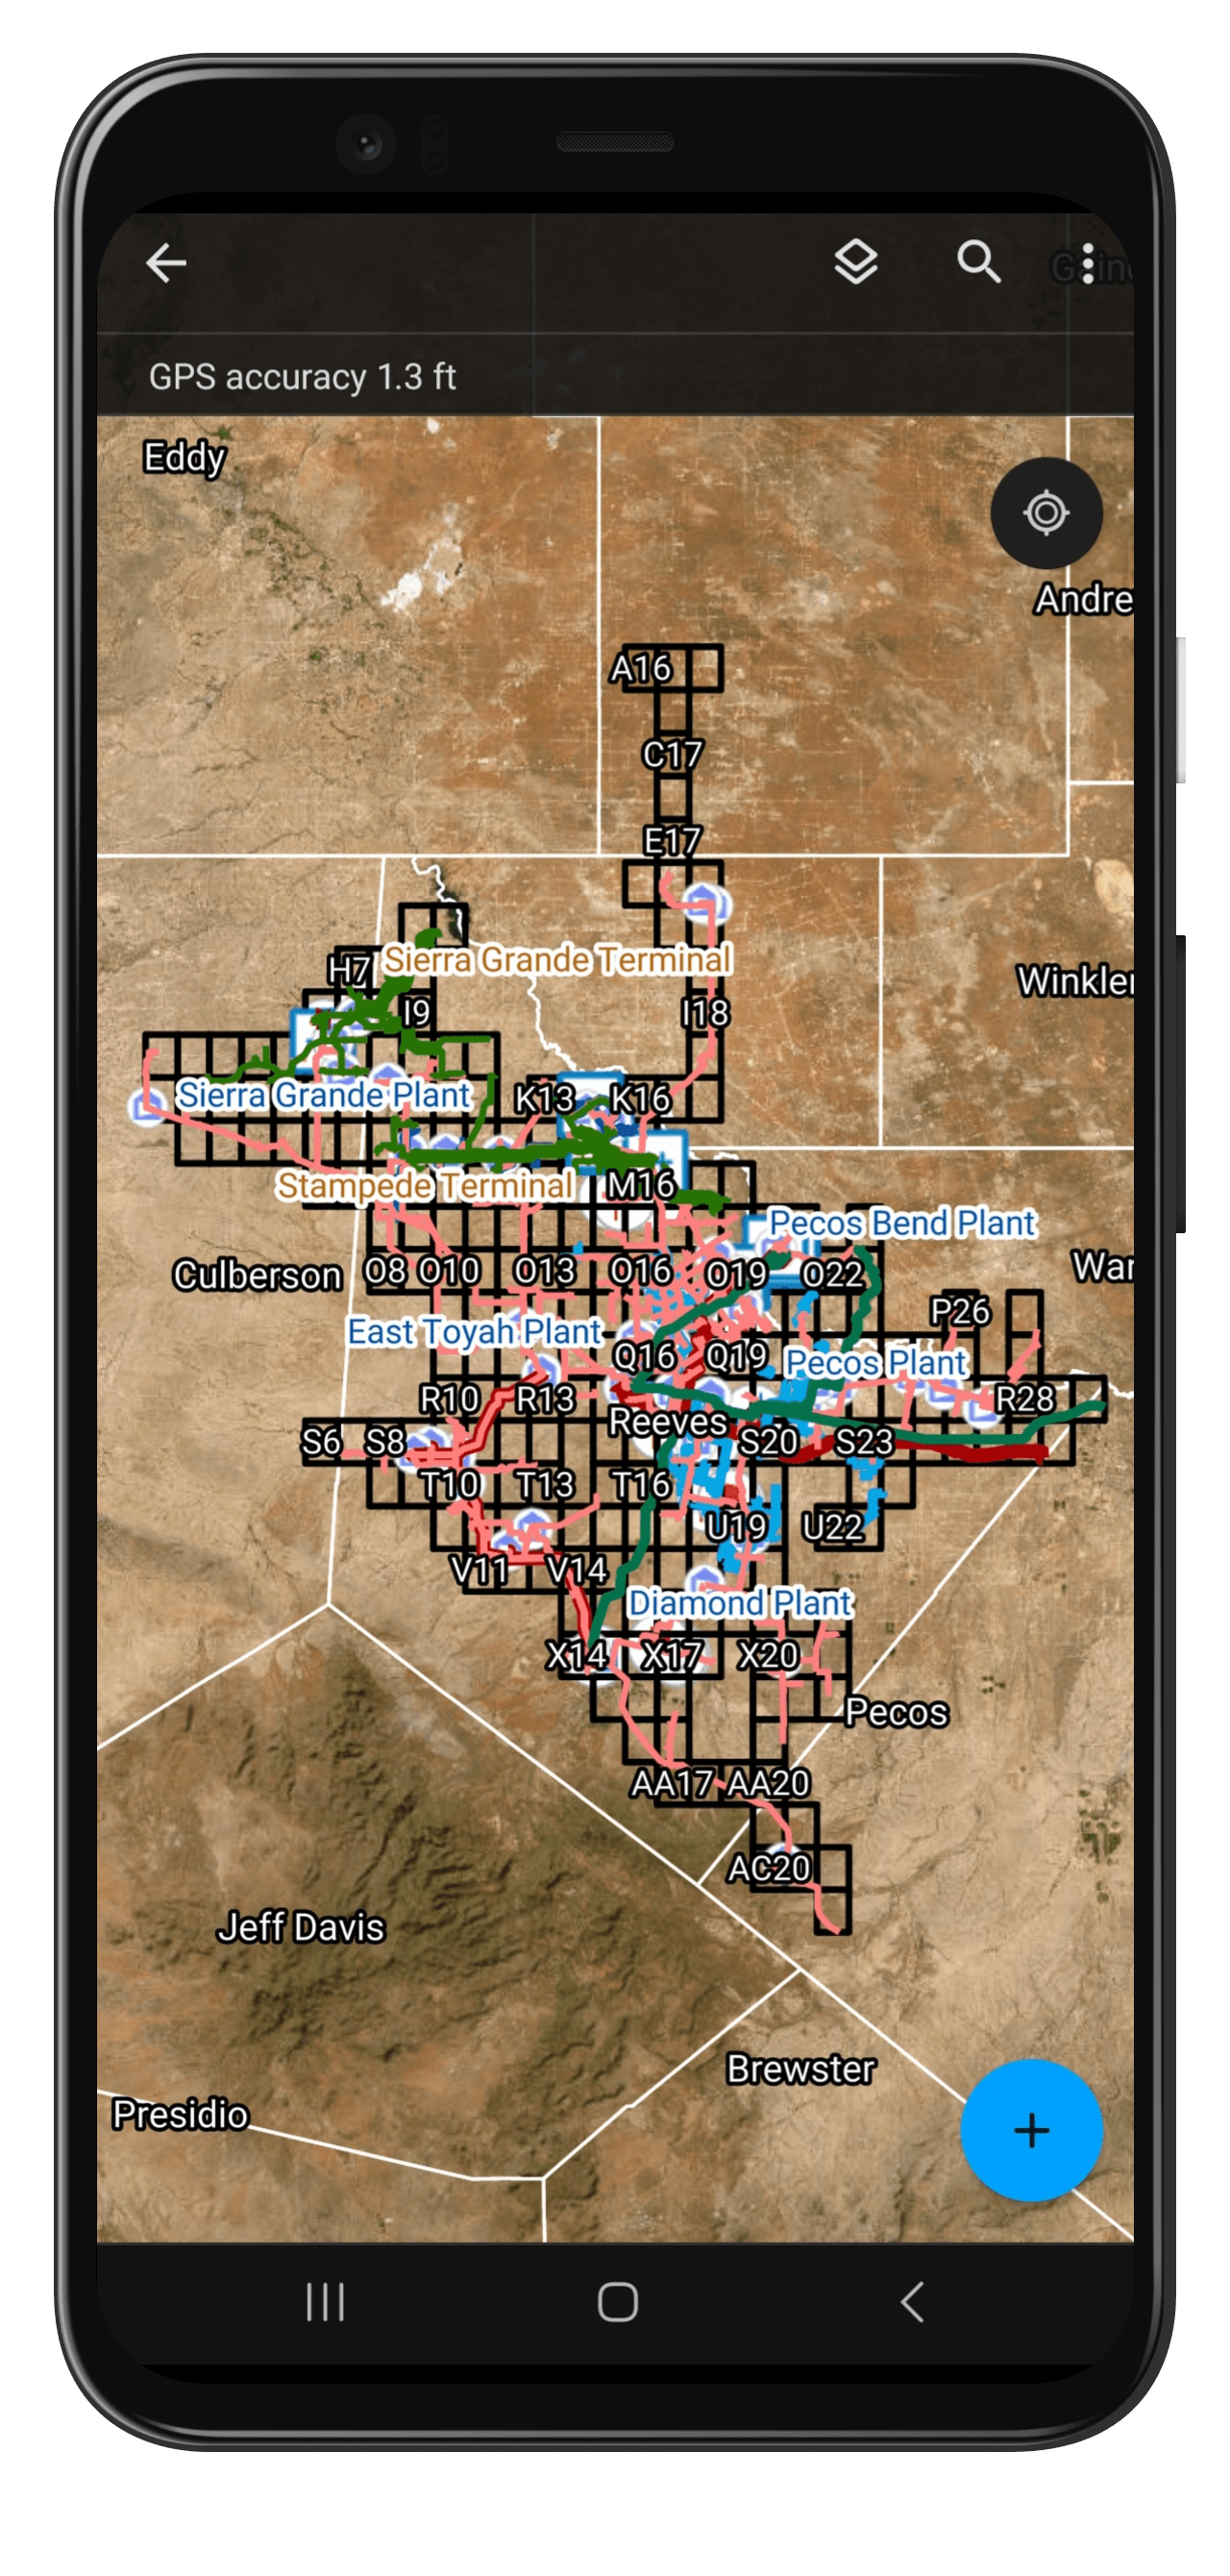
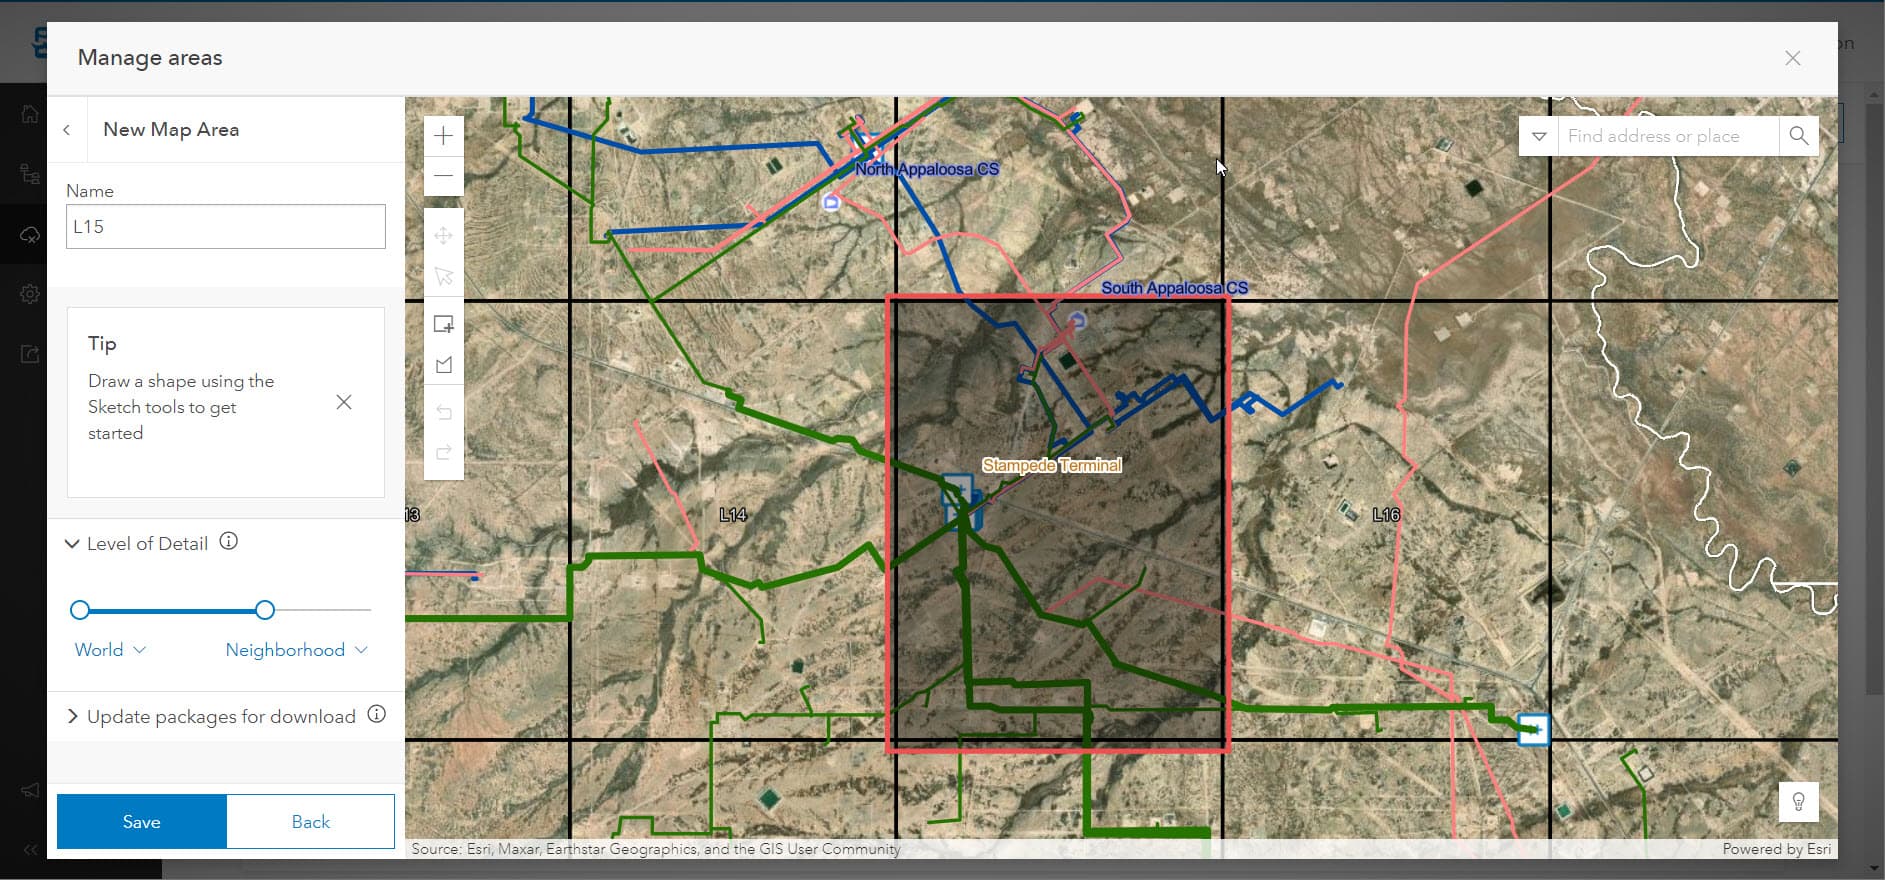
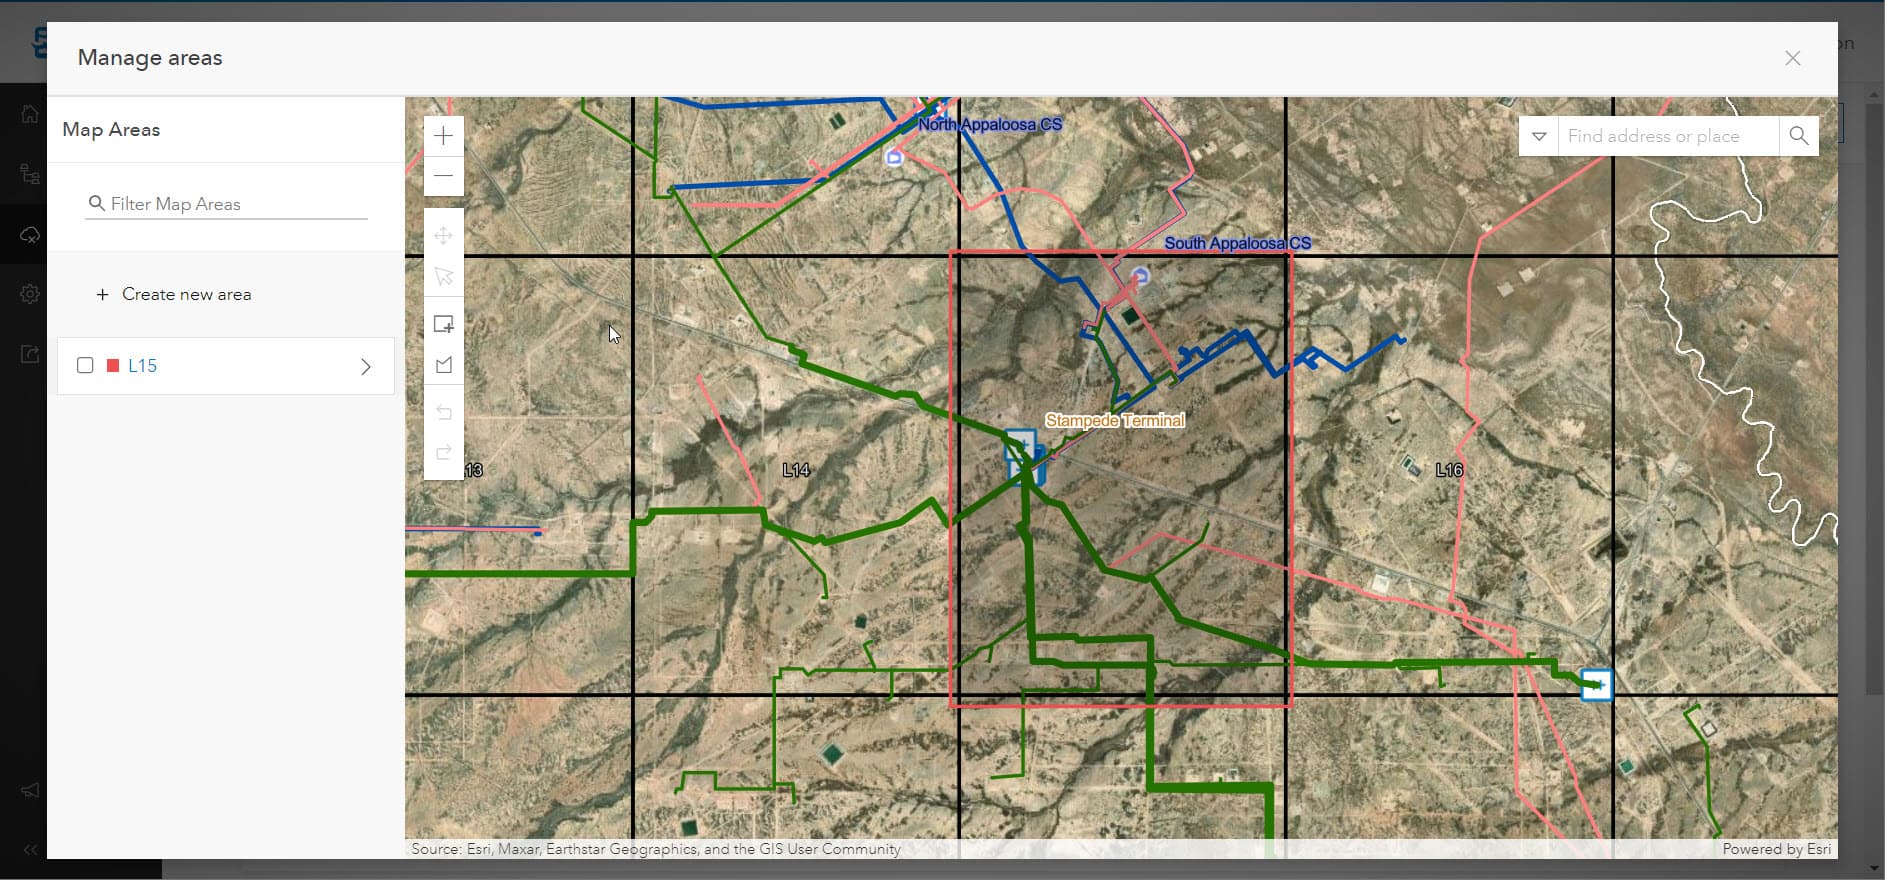
Romero configured multiple field data collection forms using a “smart form” feature in Esri’s ArcGIS Field Maps (Field Maps) app. Smart forms let Romero configure the exact information he wanted technicians to collect. He standardized data capture with dropdowns, conditional settings, and mandatory fields (e.g., such as diameter and photo attachments). All data is captured to match the PODS7 data-model domains, ensuring less office work for Romero. To ensure staff could collect data in the “dead” zones of West Texas, he predefined map-grid tiles with imagery and packaged these for offline use.
Importantly, he ensured the field forms required minimal data-entry effort. Updating information about a launcher-receiver asset, for instance, requires just the name, a serial number, and an asset-plate photo.
“I’m trying to reduce the impact on the field user,” Romero said. “This is just one more thing they have to do. But because we’re not asking for a lot of extra work, we got a lot of buy-in from the crews and their supervisors. By doing this, we can have a large group of people collecting data for the GIS team on a regular basis.”
Arrow Gold GNSS Receiver for Location Accuracy
“The Eos Arrow Gold gives us the confidence that the data is precise and accurate, and their support is top notch.”
— Camron Hull, Principle Consultant, Full Circle GIS
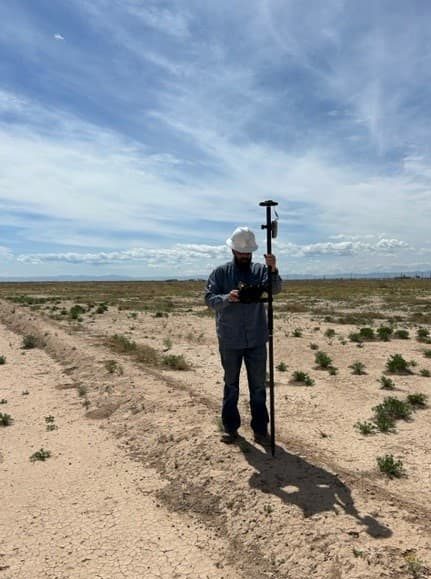
To ensure location data is reliable and repeatable, Romero deployed the Arrow Gold® global navigation satellite system (GNSS) receivers from Esri partner Eos Positioning Systems. Even when using only the Wide-Area Augmentation System (WAAS) real-time differential correction source, which is freely available across the U.S., Kinetik achieved a minimum of submeter accuracy, and often better in the Texas desert.
“That’s plenty to find our pipeline in the right-of-way,” Romero said.
Since accuracy was an issue with legacy inherited data, Romero and Hull appreciated that the Arrow Gold sends GNSS metadata to ArcGIS Field Maps, so the location accuracy is always validated.
“The integration between the software and hardware was seamless,” Romero said. “All I had to do was Bluetooth® pair an iPad® to the Arrow Gold and then change the location provider to the Arrow Gold within Field Maps.”
Configuring Maps for Specific Roles
Romero created groups within ArcGIS Online to control access and editing of features from the field staff. Group members can only access specific map-based data-collection forms and layers (i.e., information) within Field Maps. For instance, line locators who want to update the centerline can access a specific map just for that application.
“I made specific map layers by discipline,” Romero said. “That way those staff members can focus on their job and not be encumbered by other assets that are not part of their workflows.”
Some of the groups Romero created:
- Line Locators Group, who can update centerline locations
- Inspectors Group, who can collect valve data
- Pigging Group, who can update pig-related equipment
- Corrosion Group, who can update information on test stations and rectifiers
- Measurement Group, who can capture locations for new meter installations
Romero publishes map layers and Field Map forms to web maps via ArcGIS Pro and ArcGIS Online. Technicians can then access these maps on their mobile devices in Field Maps. The forms are exceedingly simplified, sometimes requiring a minimum of two or three fields of data collection. New meters, for instance, are configured such that the technician need only capture the meter location during installation, with the option to take photos of the meter tube and asset plate; everything else is pre-populated by Romero from the Measurement team’s “New Meter Connection” form.
Because the workflows are streamlined, over time the technicians can update data and fix unrealities with a constant feedback loop from field to office.
“Kinetik’s field team, engineers, and management were gracious with their time and resources to help us get the data cleaned up,” Hull said.
Romero also created enterprise-wide map layers. This includes not only a real-time view of the most updated PODS7 data, but also other use-case-specific data layers. A weather-radar layer allows crews to ascertain wind-speed conditions before arriving on site. And a road-closure layer lets colleagues tell each other about locked gates and other obstructions in the operational territory.
“One crew drove an hour to a locked gate and then an hour back to find out how to get through the gate,” Romero said. “If this system had been in place before then, they would’ve seen the locked gate and gotten the combination before leaving.”
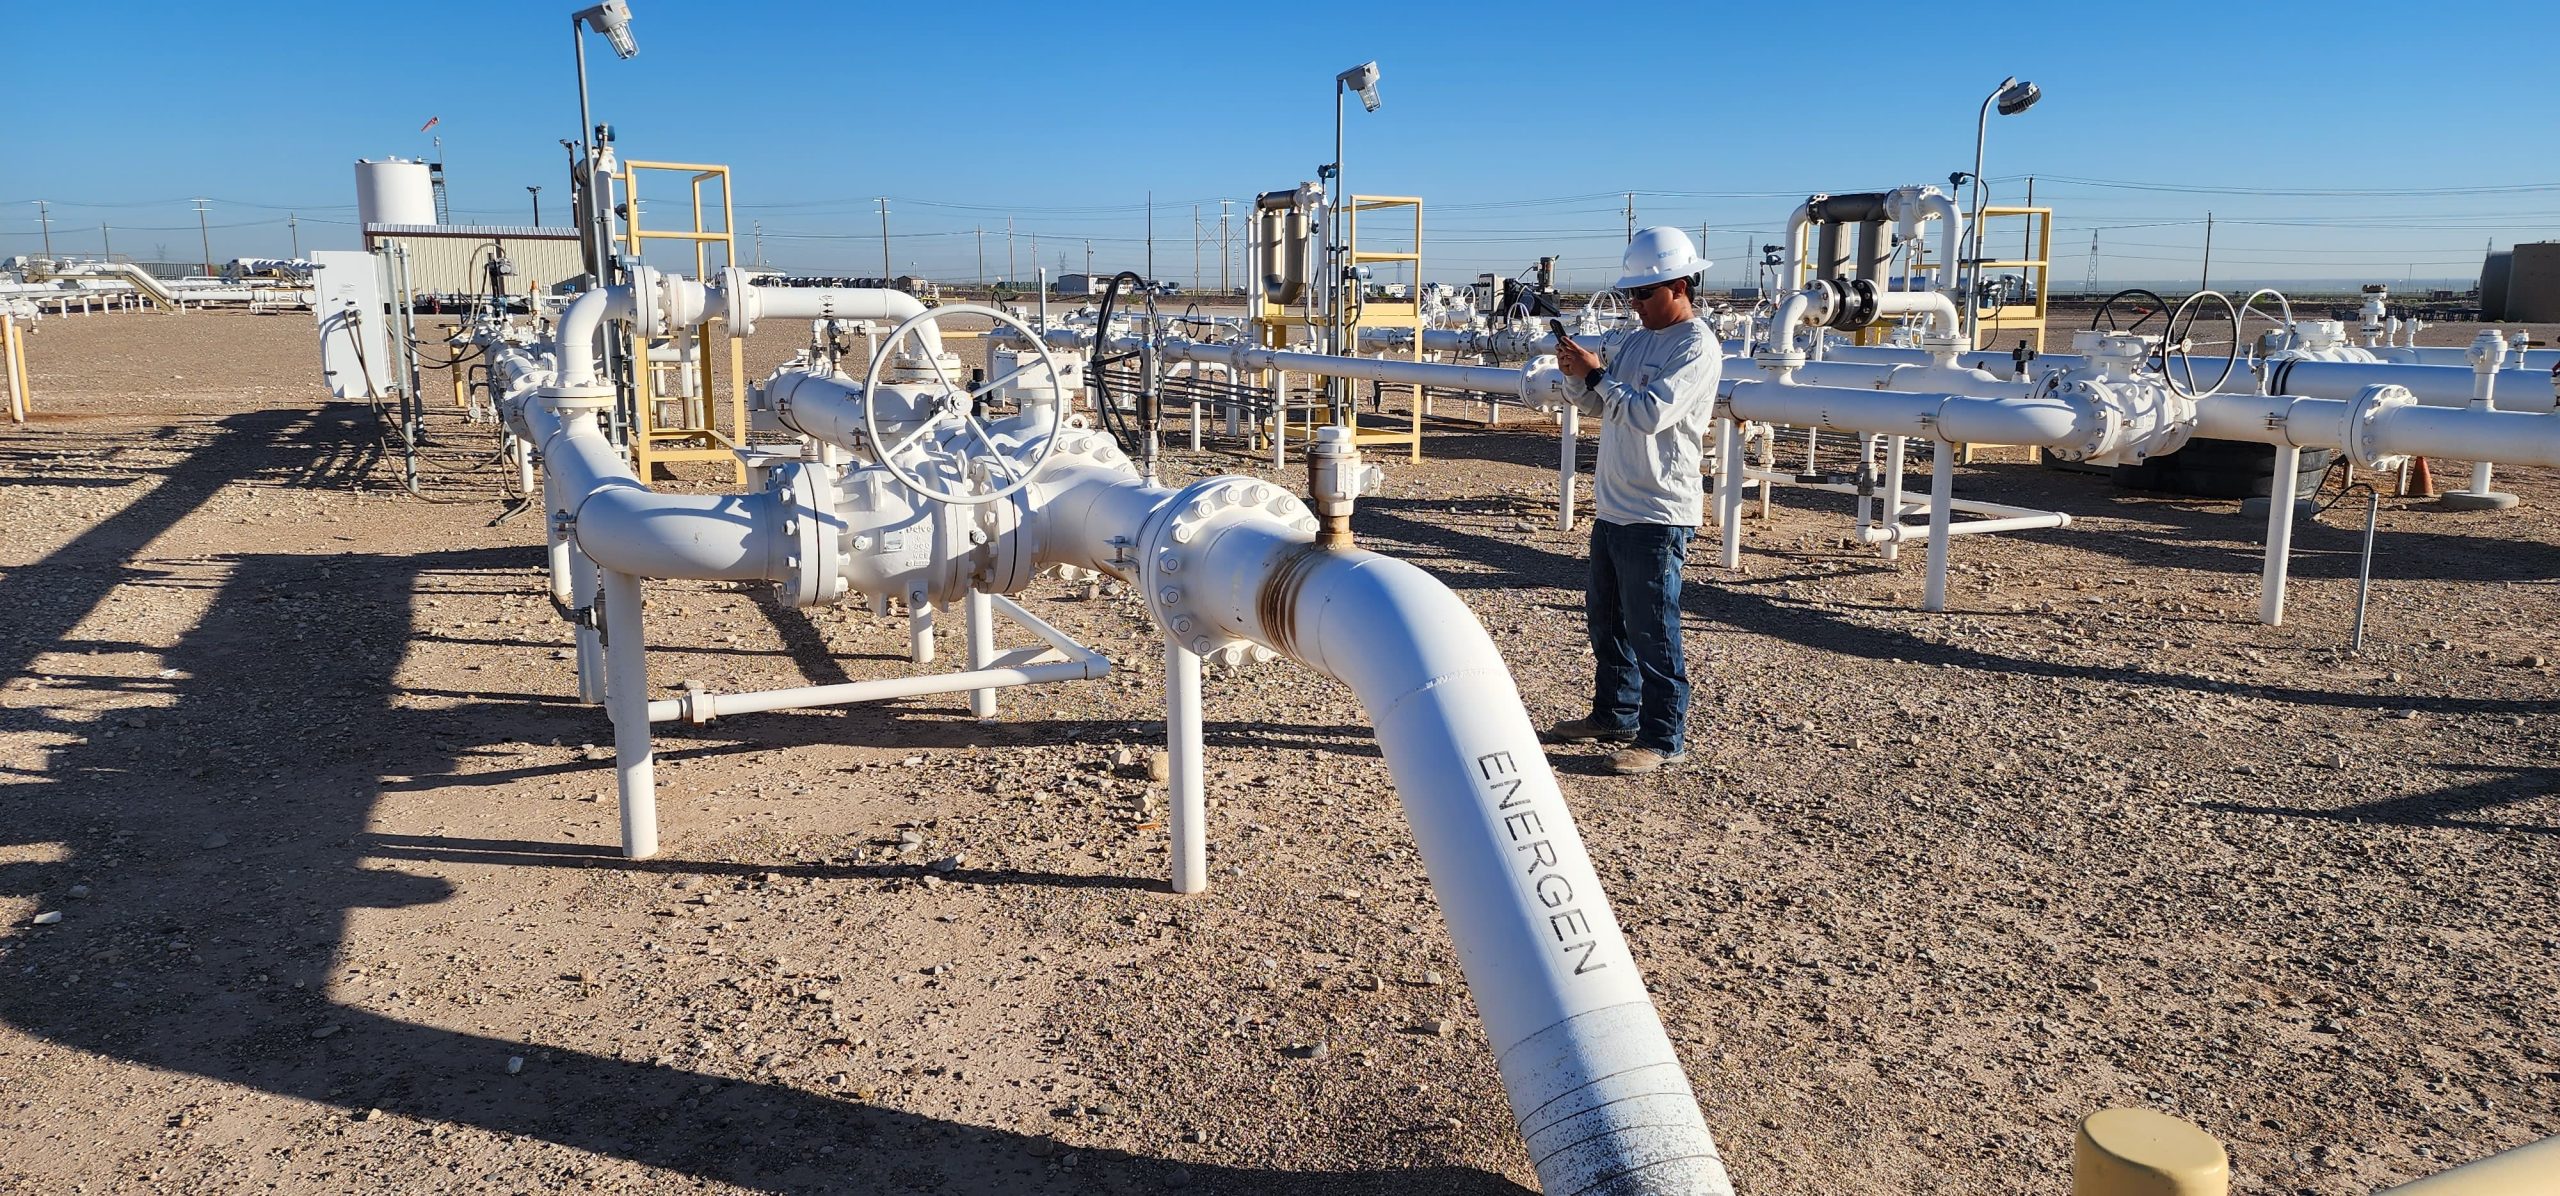
ArcGIS Pro for Quality Control
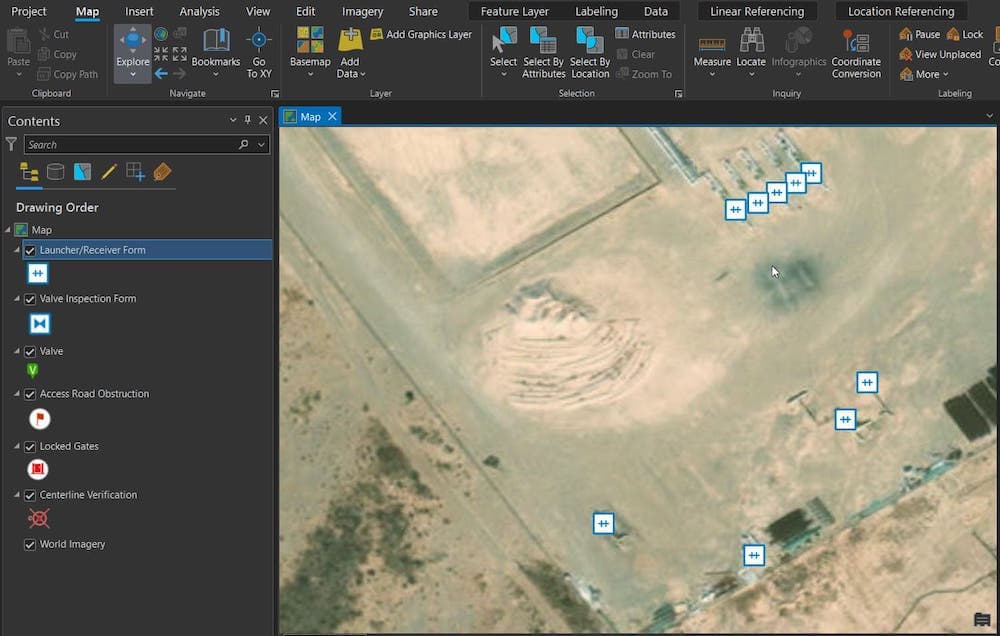
Field data syncs in real time from technicians’ mobile devices in connected areas, and upon data network availability when technicians are back from disconnected environments. Their field data goes to hosted layers in ArcGIS Pro. Romero then runs a quality check on all incoming field data and publishes validated data to the enterprise data model and GIS, where it becomes available instantly to all Kinetik employees.
“We can automatically see the updates in our table of contents, so we can see the data when it’s loaded,” Romero said.
The result so far has been a near 24-hour turnaround from field to office.
“Everyone’s reaction has been the same,” he said. “They all say this is amazing. It sounds clichéd, but that’s always the phrase they use.”
Romero has also found other ways to enhance the enterprise GIS. Using the 3D visualization tool ArcGIS Earth, which connects directly to the Kinetik web map portal, he enabled Kinetik’s engineers to mock up new route proposals directly on real-time system data.
“Now they can plan more accurate routes, because they can draw directly in ArcGIS Earth using our real-time portal data,” Romero said.
More than a Pipe Dream: Quantifiable Results for Enterprise-Wide GIS Adoption
“The GIS is a custodian of everyone else’s data. As a custodian, I want to receive the most accurate information, so I’ve put into place the pieces that are necessary to be able to receive accurate information. We try to make it a very low-impact field workflow.”
— Papillon Romero, GIS Manager, Kinetik
Today, employee use of the GIS has improved 50-fold since Romero and Hull came on board.
“A year and a half ago, our GIS portal was generating about 1,000 views per week among staff,” Romero said. “Today, it’s averaging 8,000 to 12,000 views per day. The employee confidence has risen substantially. People are in the portal, zooming around, and looking at the data all day long. The GIS is heavily trafficked.”
Not only are field technicians updating layers daily, but various other departments are utilizing GIS data. Financial staff now ask Romero for quarterly commodity mileage reports. In the past, this was a manual, time-consuming process. Now, Romero runs a few calculations, exports the figures from GIS, and creates summary pivot tables. He can easily provide Kinetik’s Compliance team the figures required for quarterly and annual reports. “This is a huge upgrade from the past,” Romero said.
By strengthening the GIS confidence and streamlining the field-to-office data loop, Romero and Hull ensured not only that Kinetik’s centerline data was high confidence, but also that all future data could be captured at a similar level.
“The GIS is a custodian of everyone else’s data,” Romero said. “As a custodian, I want to receive the most accurate information, so I’ve put into place the pieces that are necessary to be able to receive accurate information. We try to make it a very low-impact field workflow.”
Romero emphasizes the ease-of-use of the technology. Meanwhile, Hull points out the hidden gem at Kinetik, which is everyone’s willingness to help.
“The biggest reason we have been successful is because the entire Kinetik team has embraced the plan to make GIS as the system of record,” Hull said. “Everyone has pitched in, from the C-suite to the field technicians, to offer support and resources to collect and verify data. It really has been remarkable to see the ownership everyone at Kinetik has taken on this project over the last year and a half.”
Overall, Kinetik’s new GIS strategy is playing a pivotal role in transforming the company’s operations and fostering efficiency, safety, and collaboration across the organization. It has proved to be a strategic asset that is strengthening Kinetik’s competitive edge in the midstream pipeline industry and is serving as a robust foundation for the company’s ongoing growth and expansion.

