All along the California coast and beyond, beaches play a crucial role as vital global habitats. They provide refuge, nesting sites, and foraging grounds for shorebirds and invertebrates. Their “geomorphic and ecological” features — including dunes, vegetation, and drift lines — contribute significantly to stabilizing the shoreline and expanding the area of dry beach accessible to animals, vegetation, and the interconnected ecosystems they sustain. Additionally, beaches are good for humans. They’re places to relax, recreate, and reconnect with nature.
Dr. Kyle Emery describes succinctly the high-impact role beaches play in our world: “Beaches are not only iconic and cultural,” said the Assistant Researcher at the Marine Science Institute of the University of California, Santa Barbara (UCSB). “They also represent vital ecological and economic assets.”
Beaches are also dynamic. They change — often. Anyone who ever built a sandcastle has seen how a gust of wind or high tide can quickly change their canvas.
Growing up in New Jersey, Emery witnessed how high tides, seasonal patterns, and storms changed the coastline. Today, he and other researchers have identified sandy beaches and nearby dunes as among the ecological systems most vulnerable to sea level rise (SLR). This is why Emery is now leading a three-year research project — funded by the California Ocean Protection Council — to develop methods to measure and monitor how beaches change seasonally and after strong events, in order to help other researchers predict how future SLR might permanently change these ecosystems.
“Ultimately, we want to enable others to plan for changes to beach and dune ecosystems,” Emery said.
Video Recap
How Do You Measure Sandy Beaches and Dunes?
Predicting the impact of SLR depends upon a strong understanding of how sandy beaches and dunes normally change with the seasons. Historically, it’s been challenging to monitor coastal sites. They are already a very dynamic place, and the investment in technology and human resources to undertake the effort has been traditionally prohibitive.
Dr. Emery wants to change that. His project combines cutting-edge technologies in innovative ways to develop what hopefully becomes a best-practice and scalable methodology for others to measure and predict beach changes. Such methods could feed larger SLR predictive models, as long as they are precise.
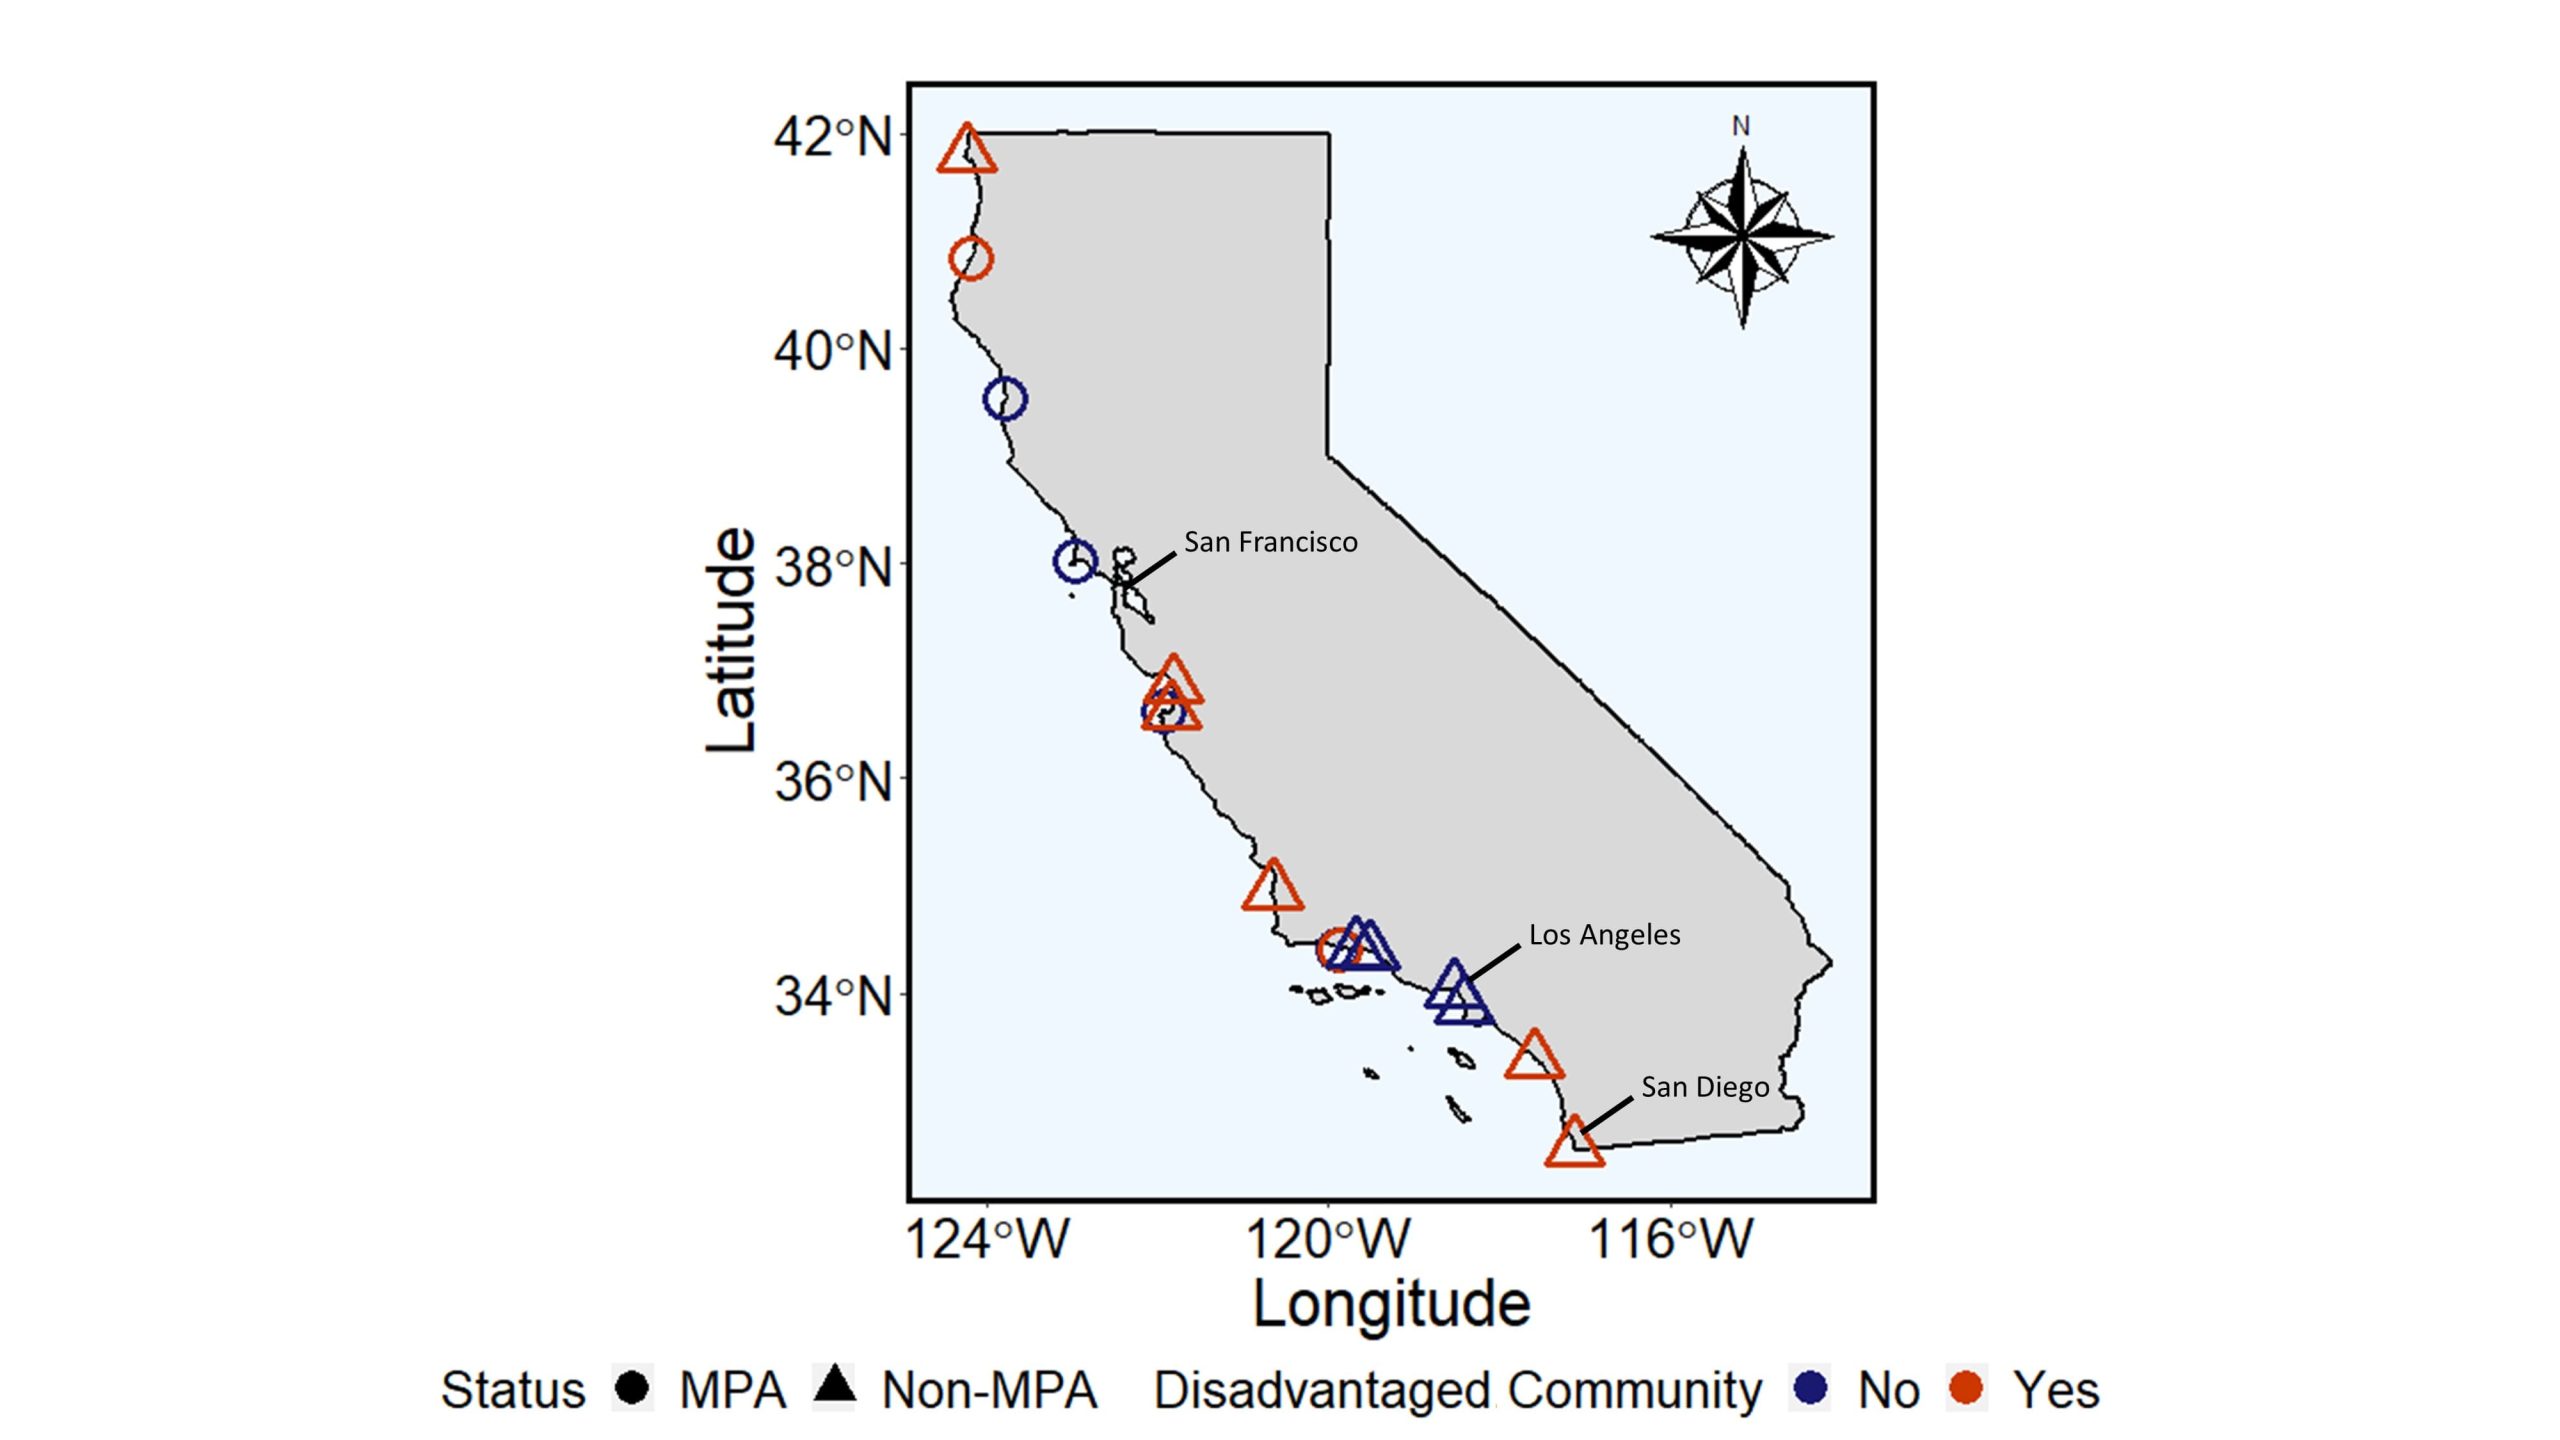
The first two years of the project emphasizes data collection. Emery chose 14 locations along the California coast, each of which contains sandy beach and dune features. The sites span as far south as the California/Mexico border and as far north as right by the California/Oregon border.
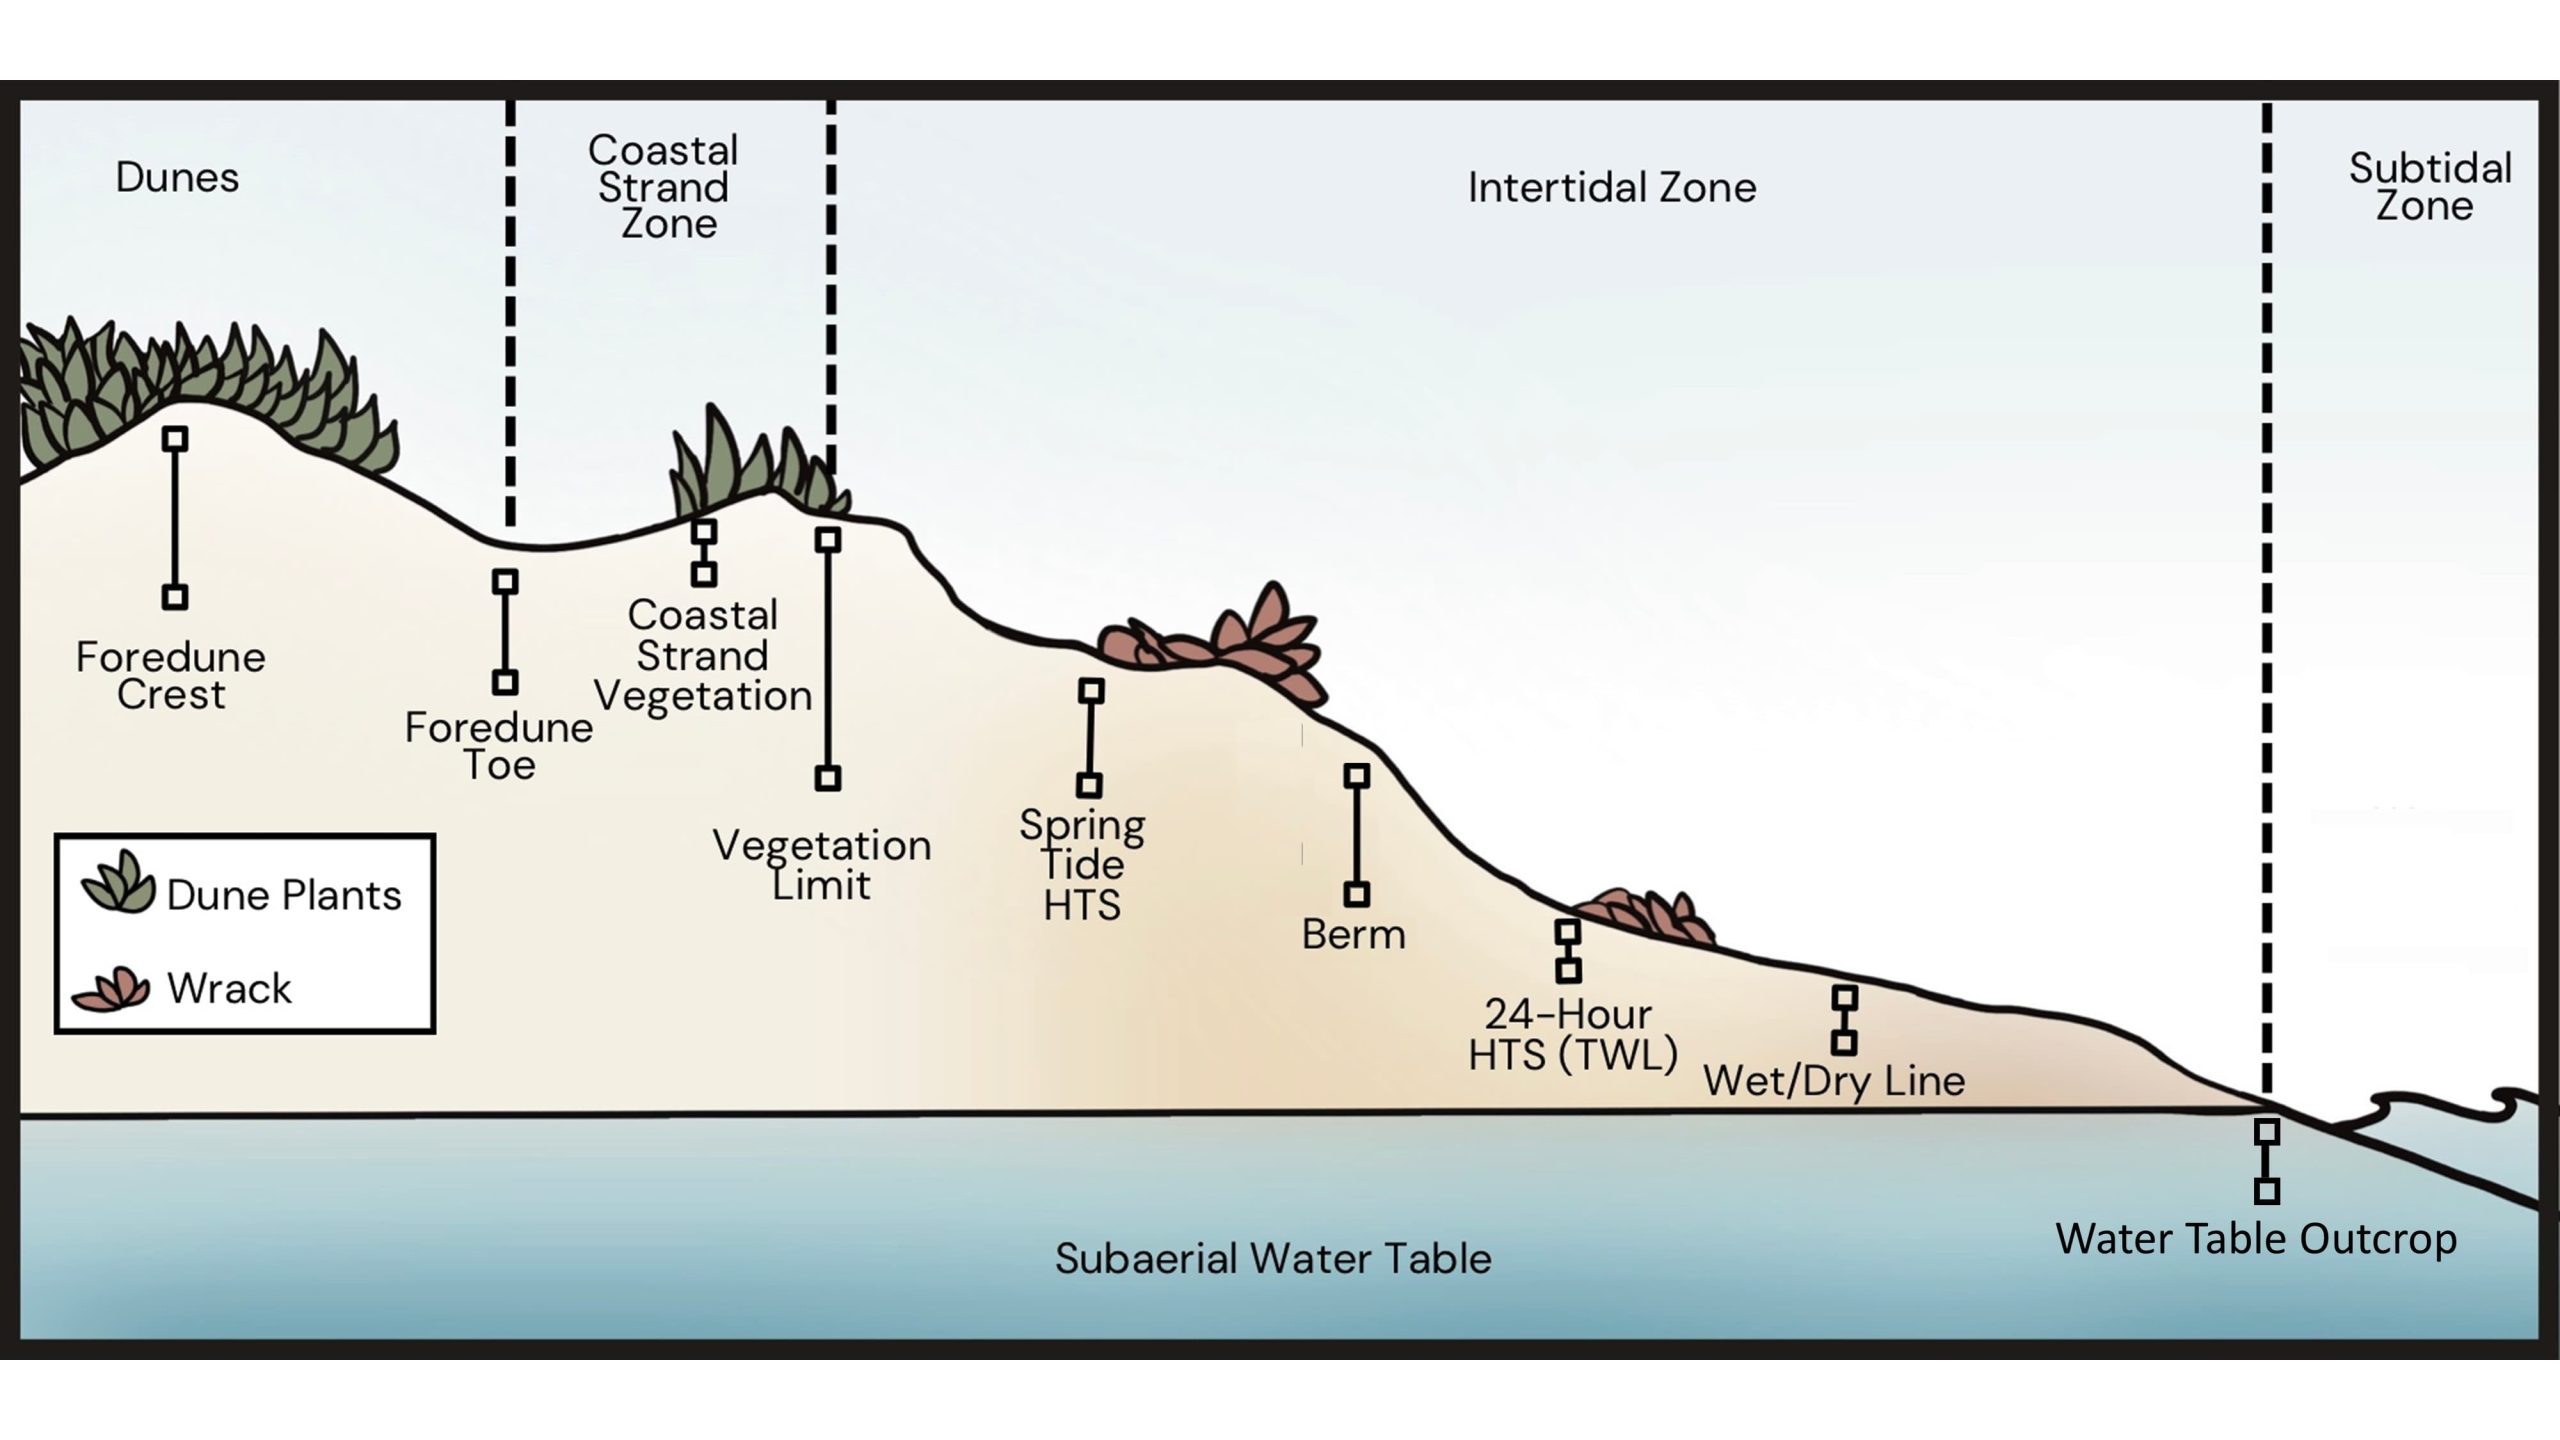
During site visits, which will take place once per quarter, after any annual high tide (“king tide”) event, and after storms, Emery will measure and map various physical and ecological features such as these:
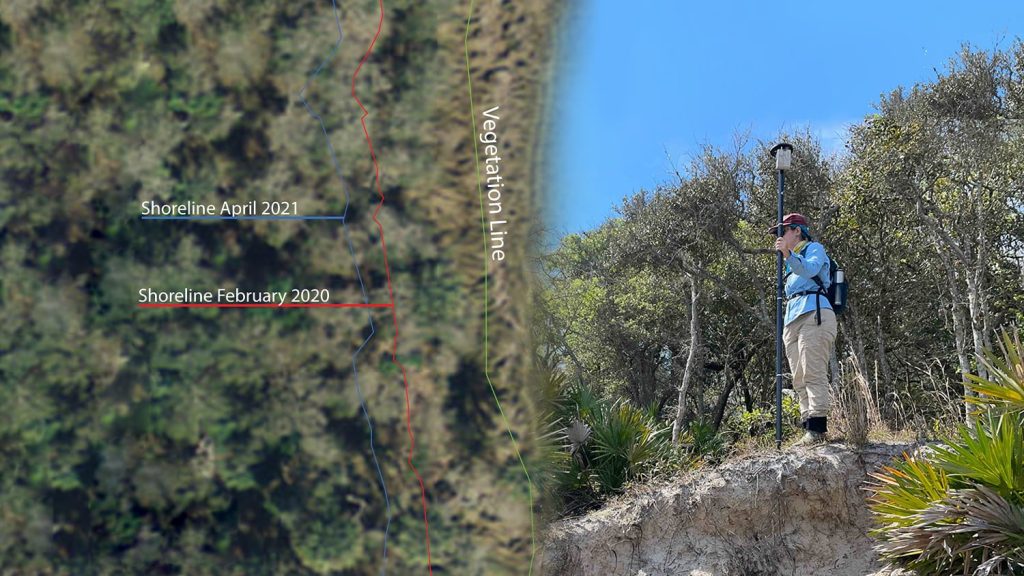
- High Tide Strandline: Positioned as the furthest inland point reached by high tide, this line holds significant implications. It serves as a critical boundary, delineating the expanse of land available for various activities such as habitat, nesting, foraging, and recreation.
- Vegetation Limit: Marking the most seaward extent of vegetation, the vegetation limit acts as an indicator of coastal habitat. Whether stable or shifting, this line provides insights into the level of protection offered by the coastal environment.
- Foredune: Identifiable as the dune closest to the water, the foredune serves as a pivotal coastal buffer, offering protection to habitat. Its location is crucial for understanding the dynamic interactions between land and sea.
- Wrack: A comprehensive term encompassing items washed ashore like kelp and driftwood, wrack holds ecological significance. It serves as a valuable resource for organism habitats, foraging opportunities, and contributes to the formation of future dunes.
- Dune and Intertidal Zones: Designating specific areas along the beach, zones like these play a dynamic role in the coastal landscape. These zones can shift seaward during expansion or landward during erosion, providing essential insights into the stability of the coastal ecosystem.
By surveying each site quarterly, Emery hopes to determine patterns in seasonal growth and erosion. By contrast, measuring sites right after extremely high tides or major storm events can serve as “proxy events” for SLR. In other words, researchers might be able to use them to predict the impact of SLR using various coastal modeling tools.
“A storm is a high-energy and high-water event, while a king tide is extremely high water without the same energy,” Emery said. “These events help us anticipate coastal changes during future sea level rise.”
Emery’s frequent data collection visits rely at first on two main technologies: drone flights and boots-on-the-ground surveys.
Capturing Drone Imagery
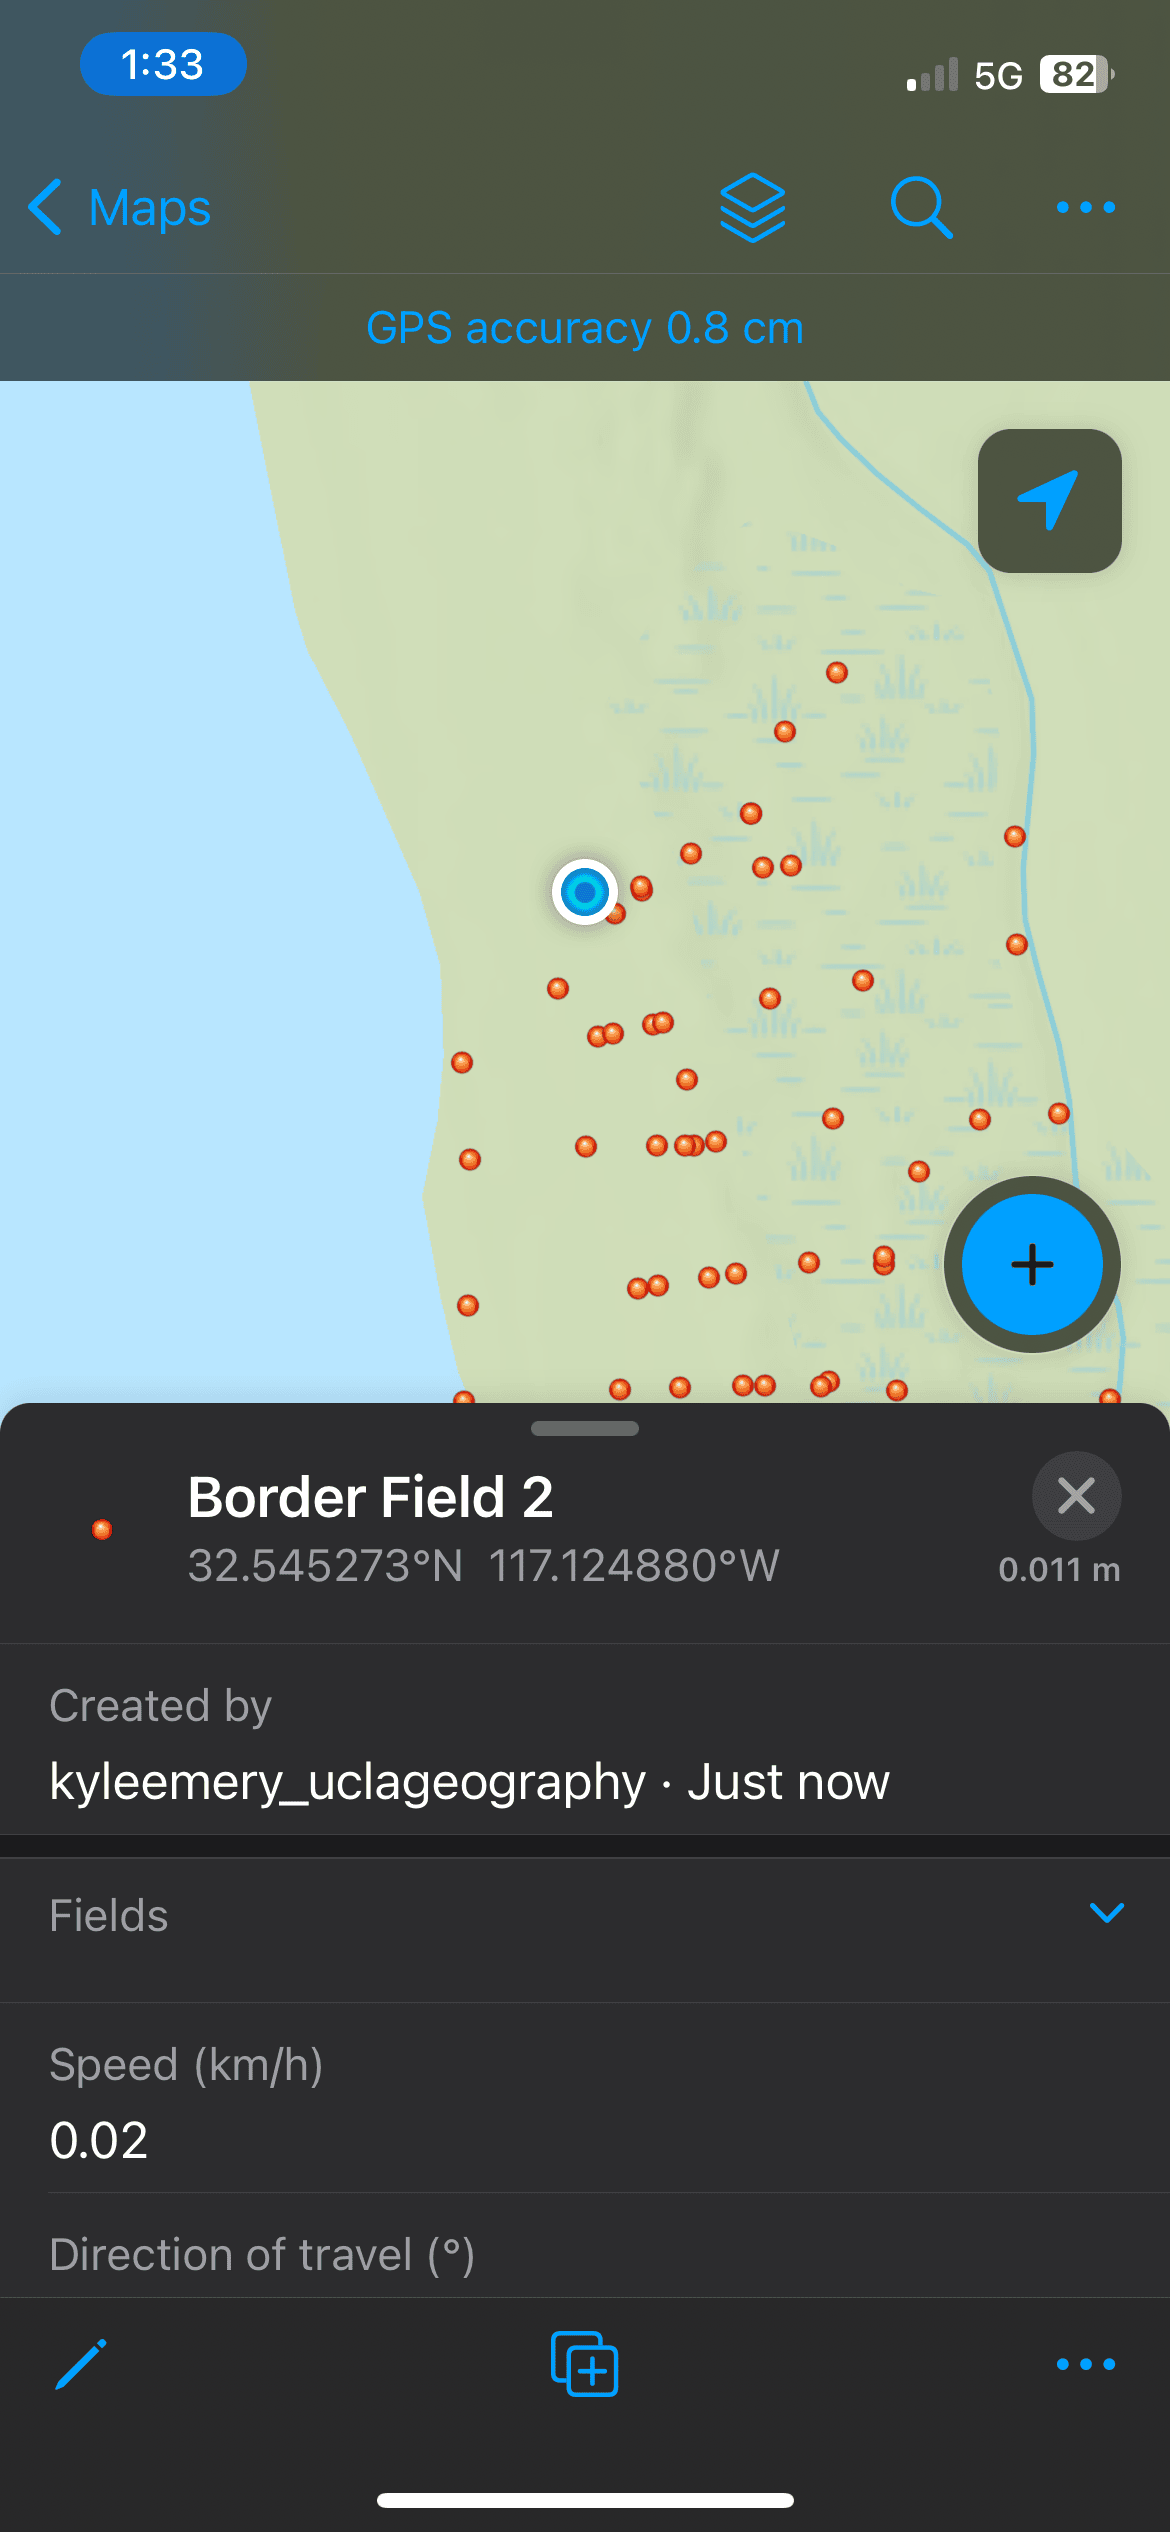
For ground control points, we use the Arrow Gold+ linked with ArcGIS Field Maps for super high-resolution position and elevation data
Each site visit starts with a drone flight. Emery uses a DJI Mavic 3 Multispectral drone. The DJI drone is able to produce high-resolution data products including orthomosaic imagery and digital elevation models, as well as vegetation indices thanks to its multispectral sensors.
Flying the drones is a process. First, the researcher sets about 15 ground control points (GCPs) across the landscape. GCPs are bright markers on the ground that show up in the imagery. Drone-processing software can then use the markers to stitch together photos and geo-reference the imagery to real points on the earth. The accuracy of the drone files, therefore, depend on the accuracy of the GCPs.
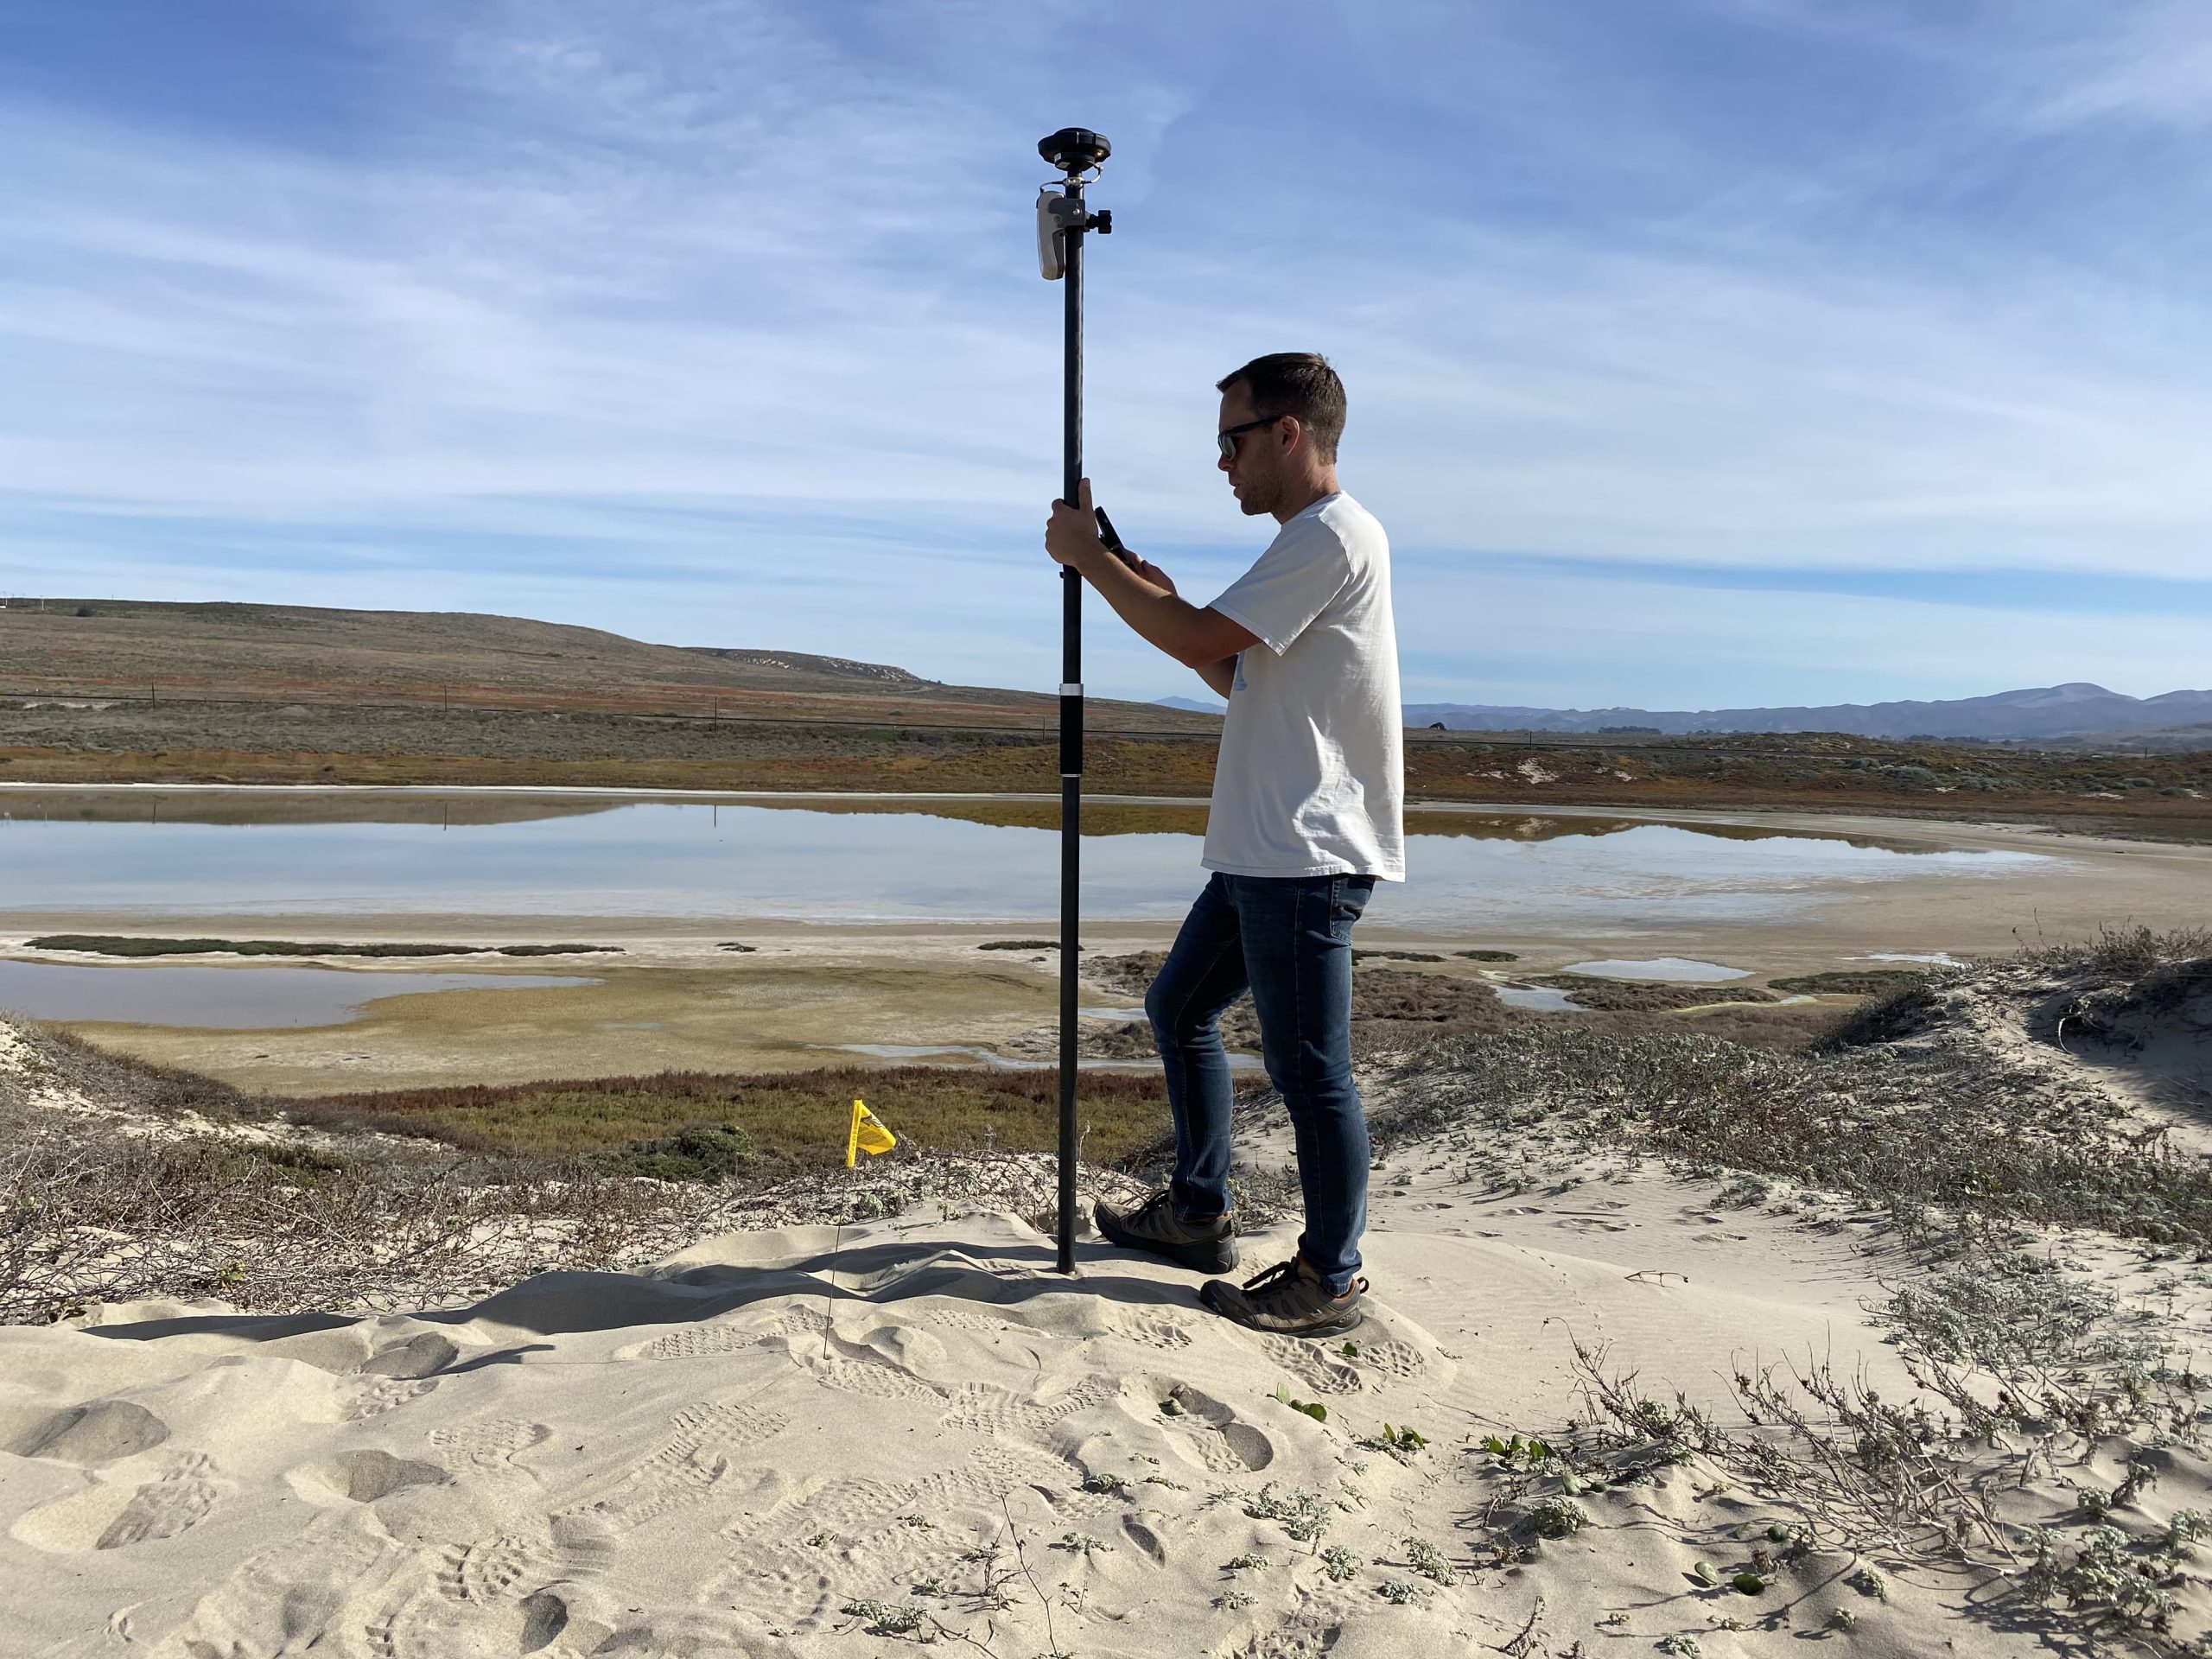
GCPs are surveyed using a professional global navigation satellite system (GNSS) receiver to achieve centimeter-level accuracy. Specifically, Emery uses the Arrow Gold+™, receiving corrections from the free California Real Time Network (CRTN), to achieve an average estimated accuracy of 1-2 cm. The GNSS receiver is Bluetooth® paired to Emery’s iPhone®, running Esri’s ArcGIS® Field Maps, a mobile software application that collects the points on a map.
With GCPs set, Emery flies the drone in a lawnmower pattern, capturing thousands of images at an 80% overlap. In the office, he uses Agisoft Metashape software to process the flight data. Agisoft Metashape outputs a set of raster files that are geospatially referenced and precise; these files include orthomosaic imagery, a digital elevation model, and vegetation indices.
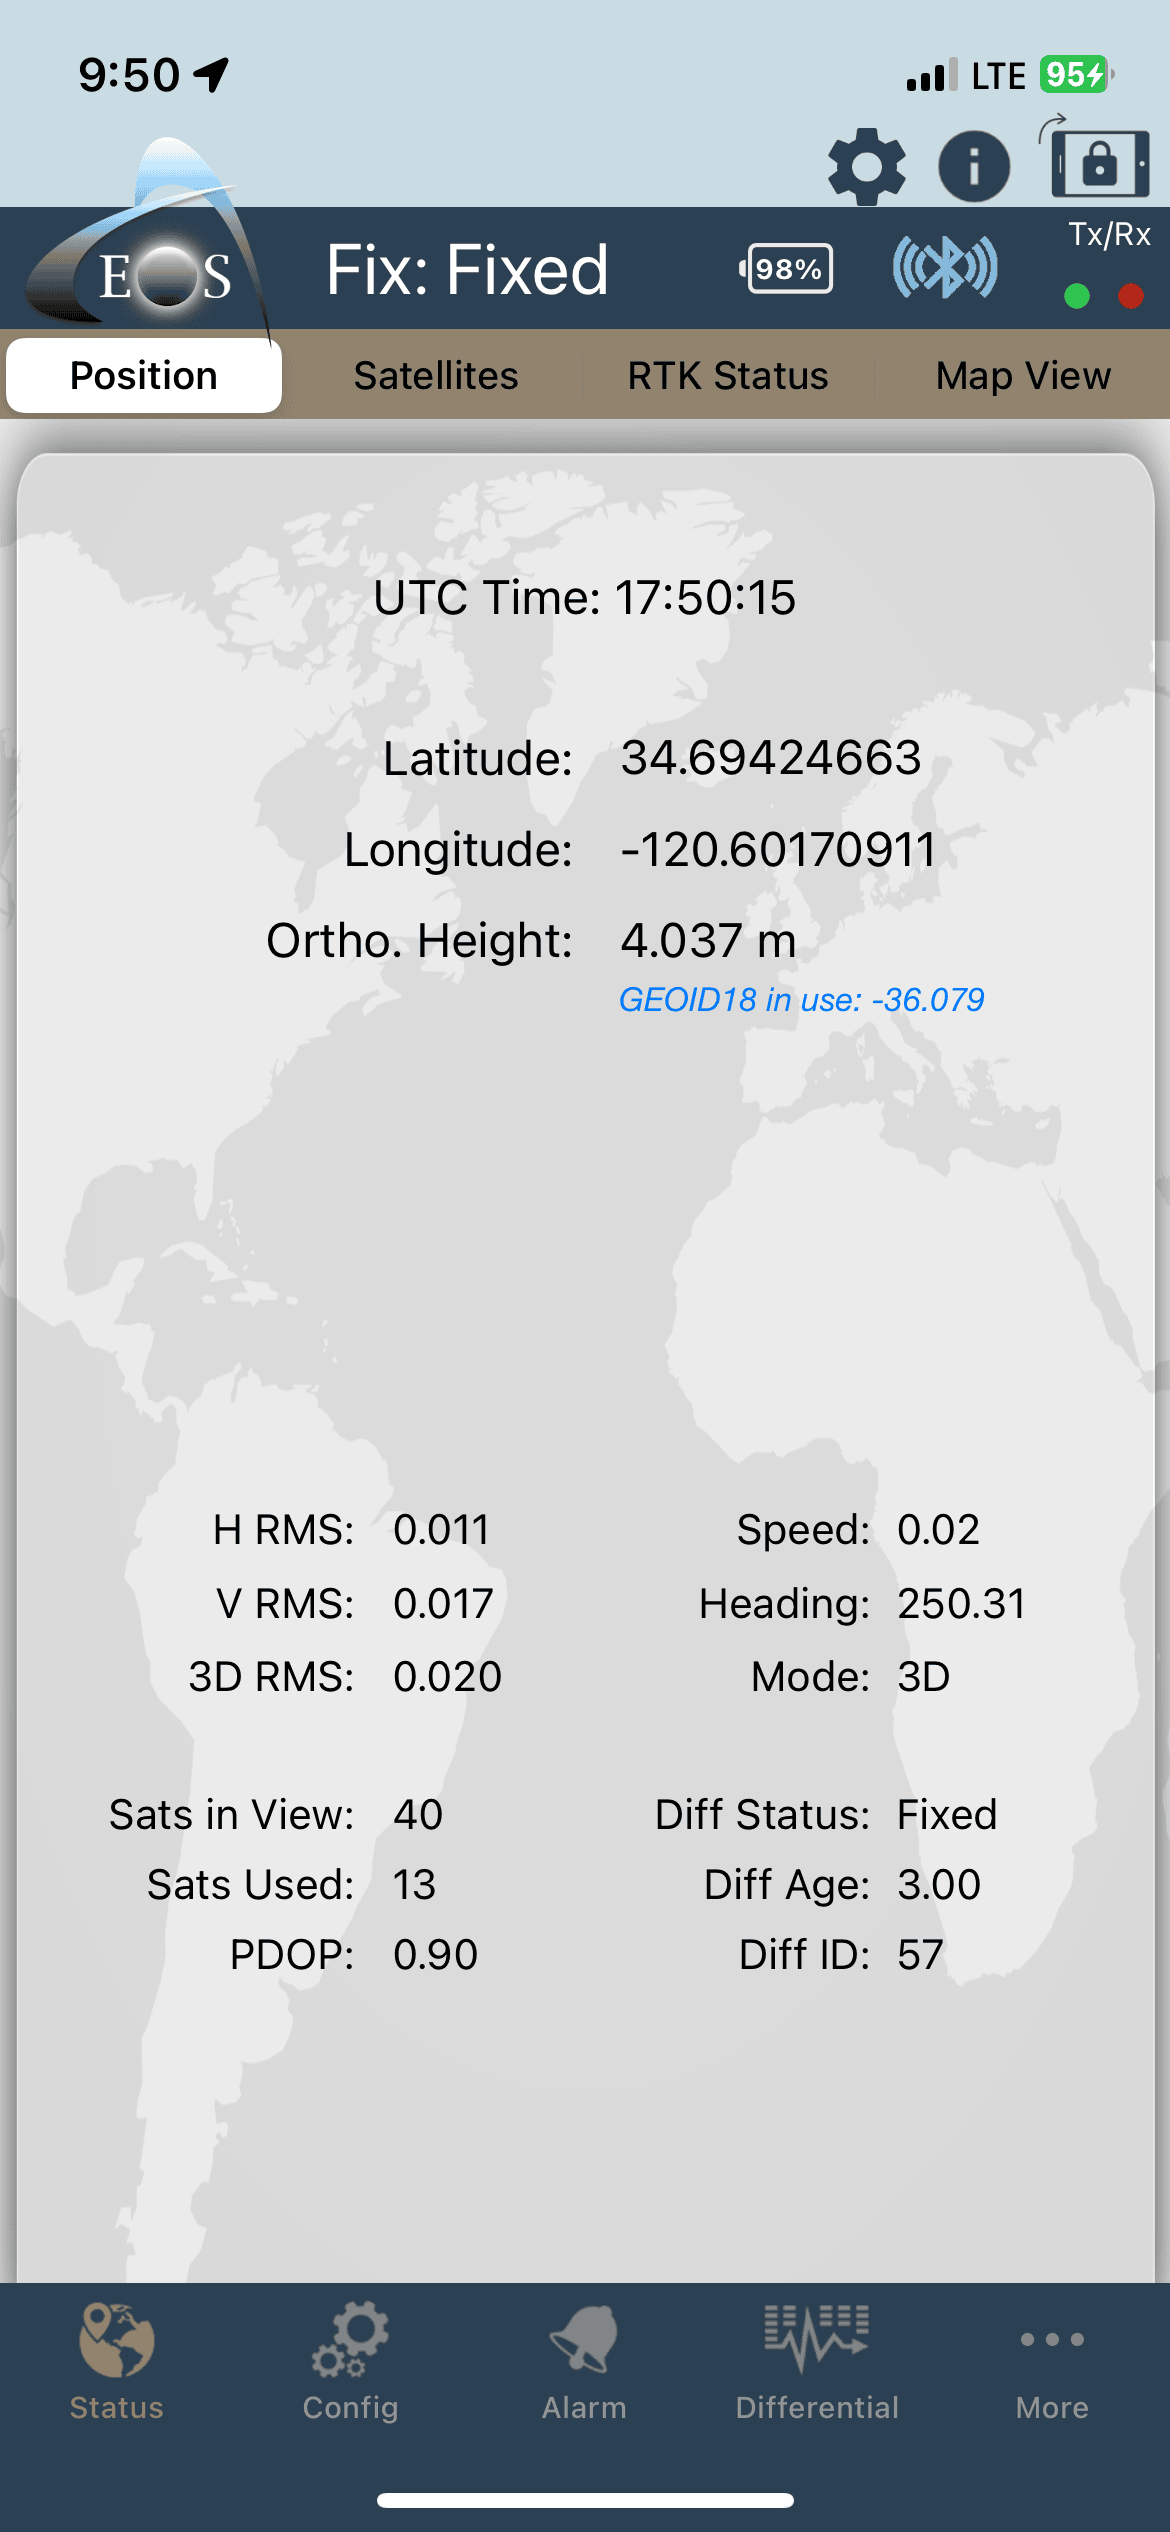
“Every pixel within the drone image has its own XYZ value, based on the Arrow telling the software exactly where the GCPs are,” Emery said. “This lets us get highly accurate positions and, importantly, elevation data.”
Orthomosaic imagery can be used to extract features like the high tide strandline, wet/dry line, vegetation limit, and foredune. Over time, horizontal movement of these positions can be ascertained. The digital elevation model provides extremely accurate vertical measurements to help the researchers understand beach growth and erosion, either seasonal or caused by extreme events. The digital elevation models also help identify further features, such as the berm boundary, embryonic dune formations (spot points where wrack could be causing sand buildup eventually leading to more dunes, a feature that adds stability to the beach), and finally the vegetation indices to map and identify different dune vegetation species.
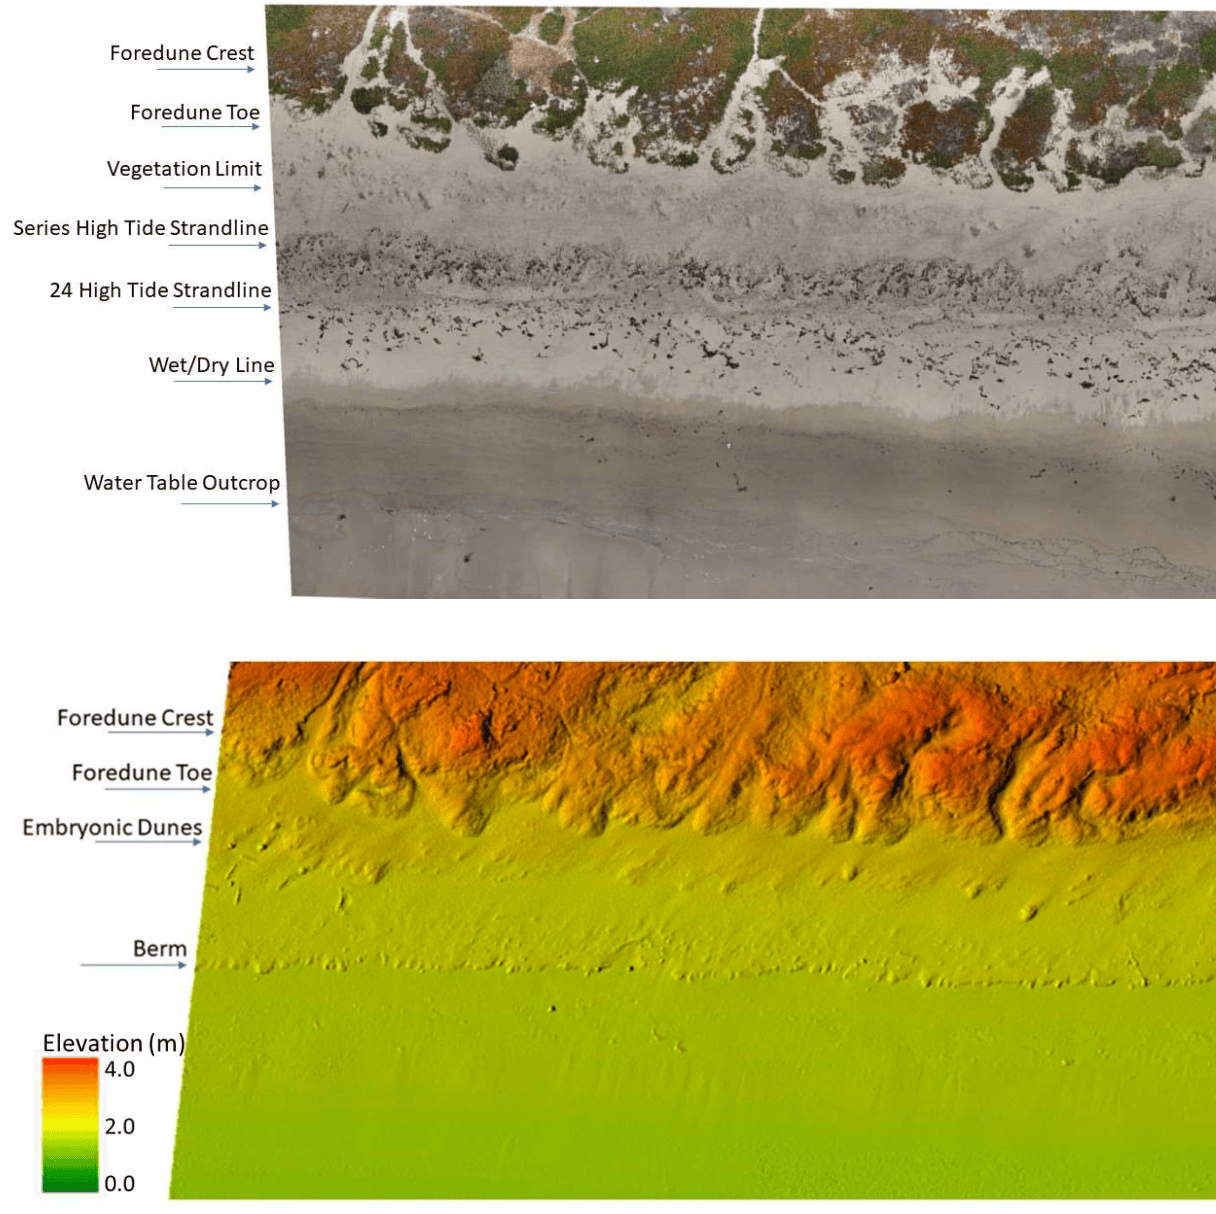
“We can track where these habitat features are over time, how their positions and elevations might or might not have changed, and how certain features move around horizontally and vertically while others don’t,” Emery said. “If there’s a storm, we can track the impacts to any of the features or zones we’ve been monitoring.”
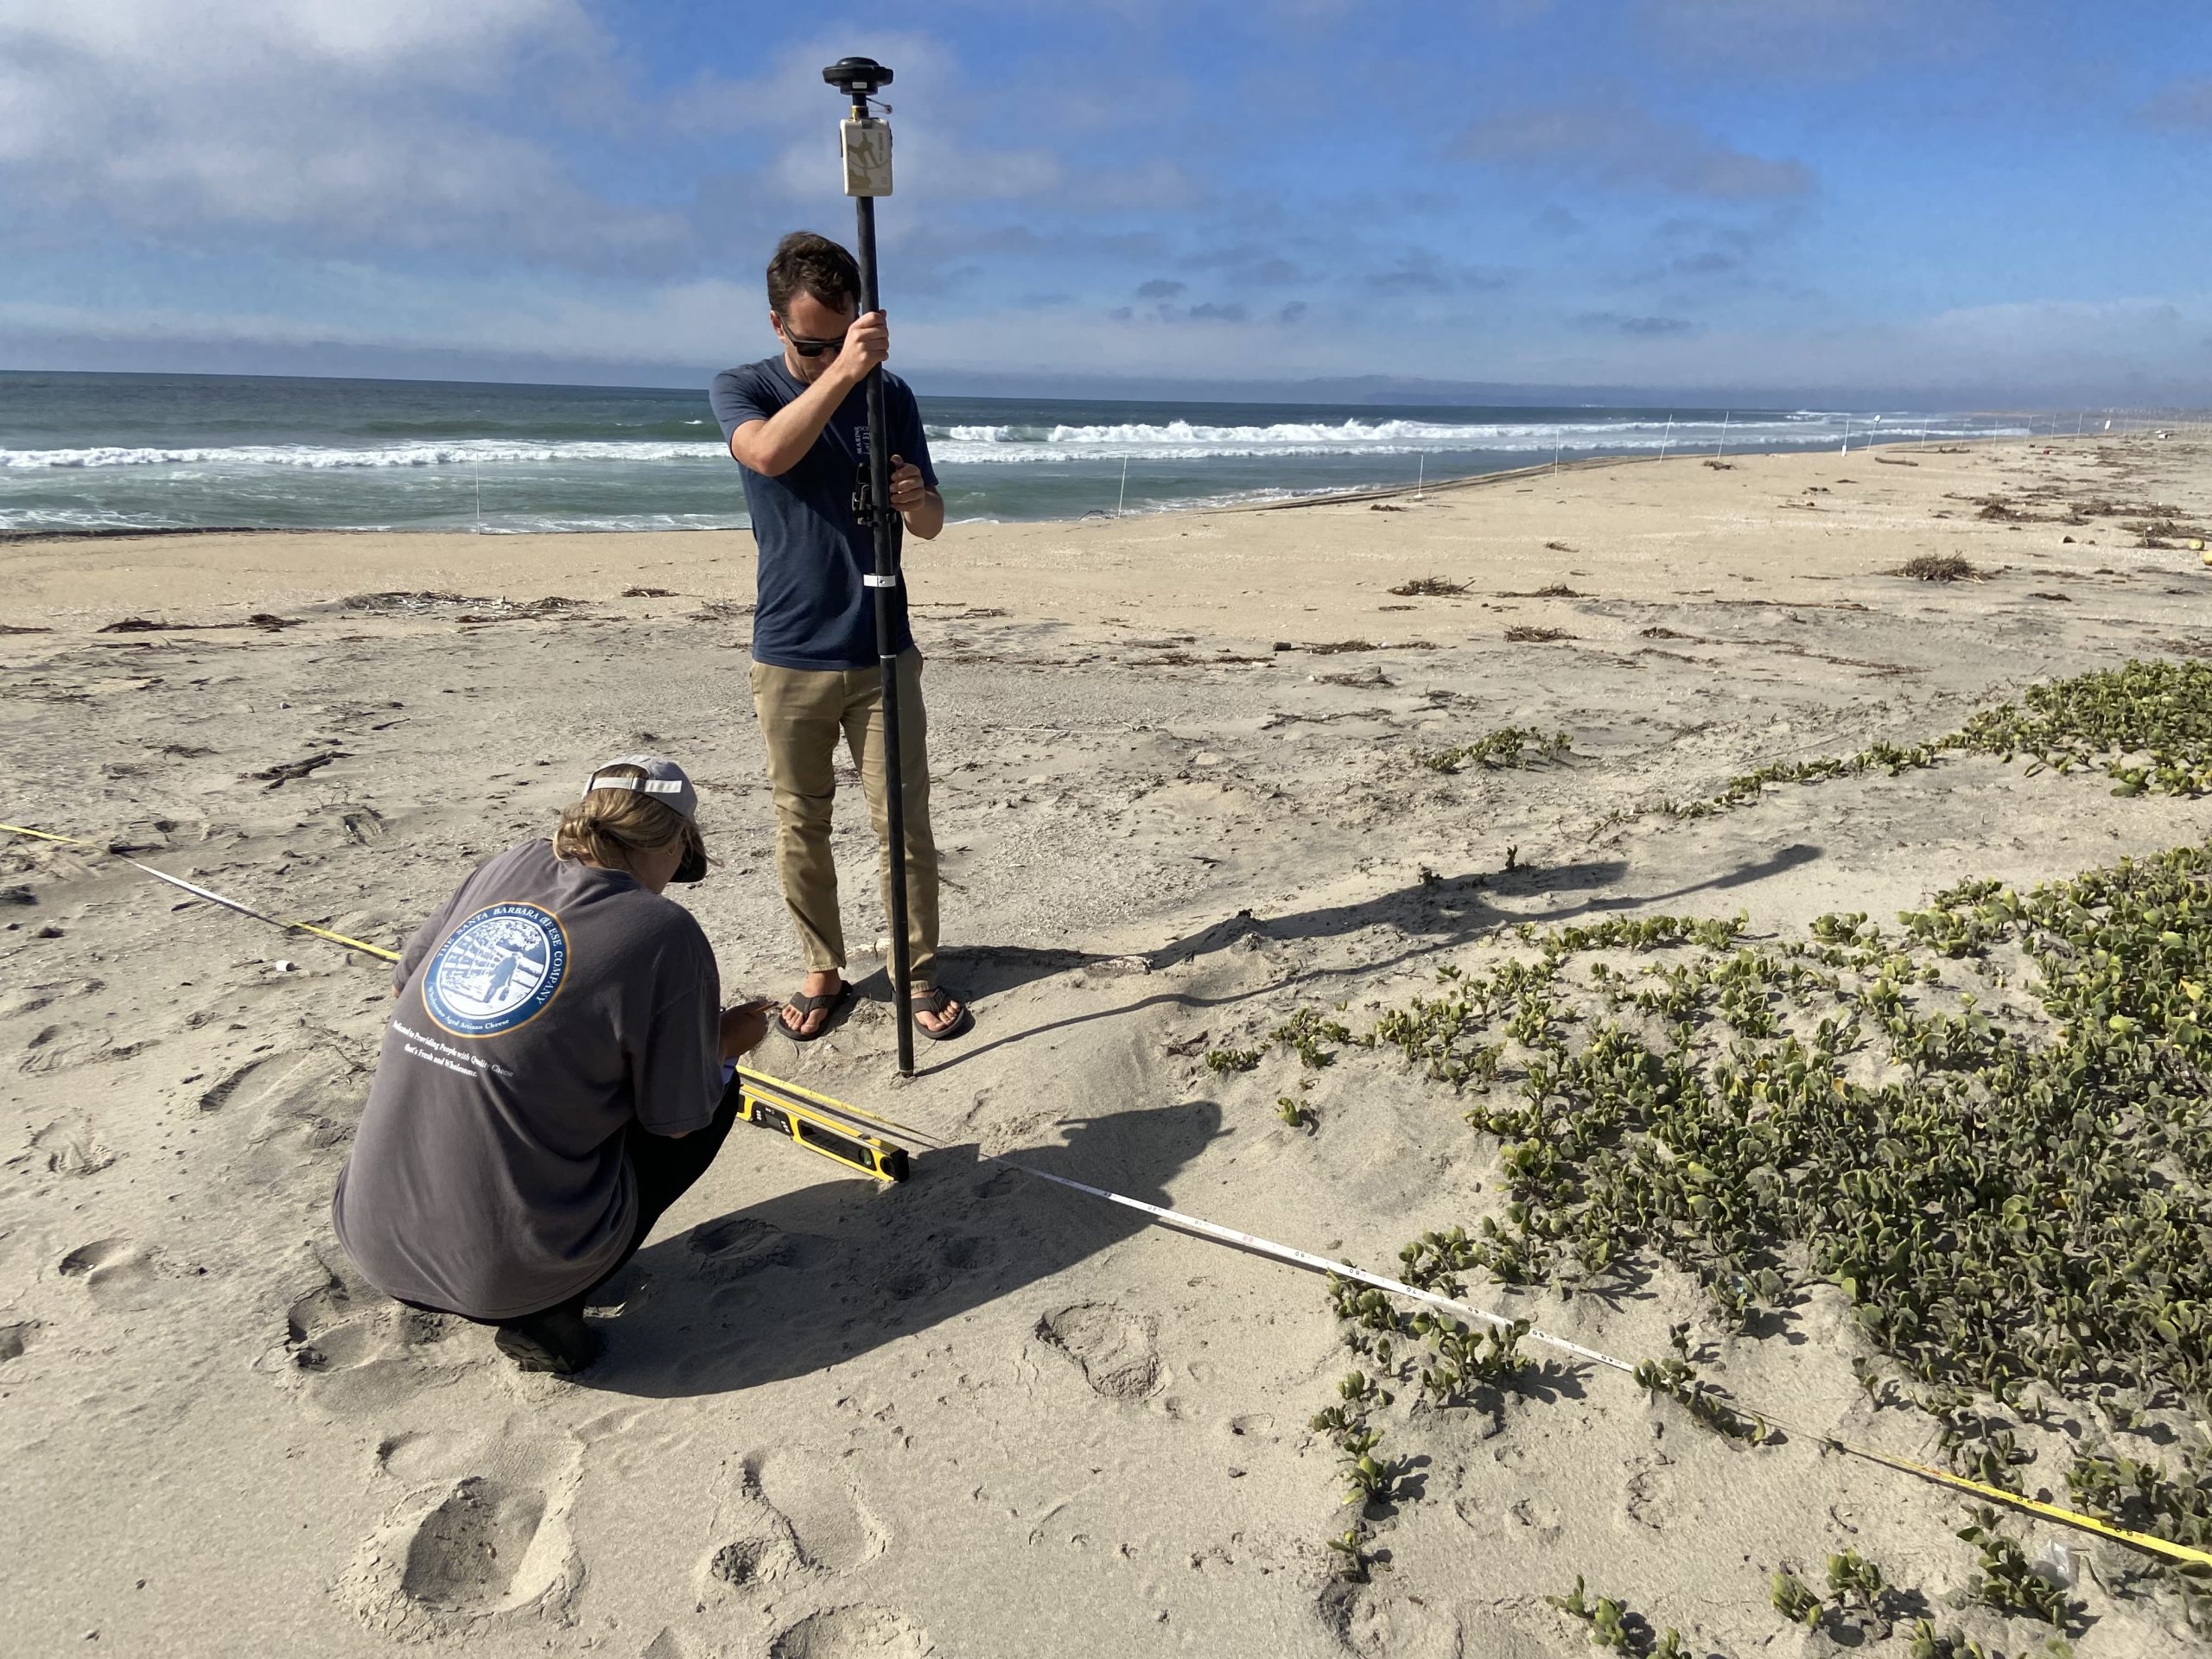
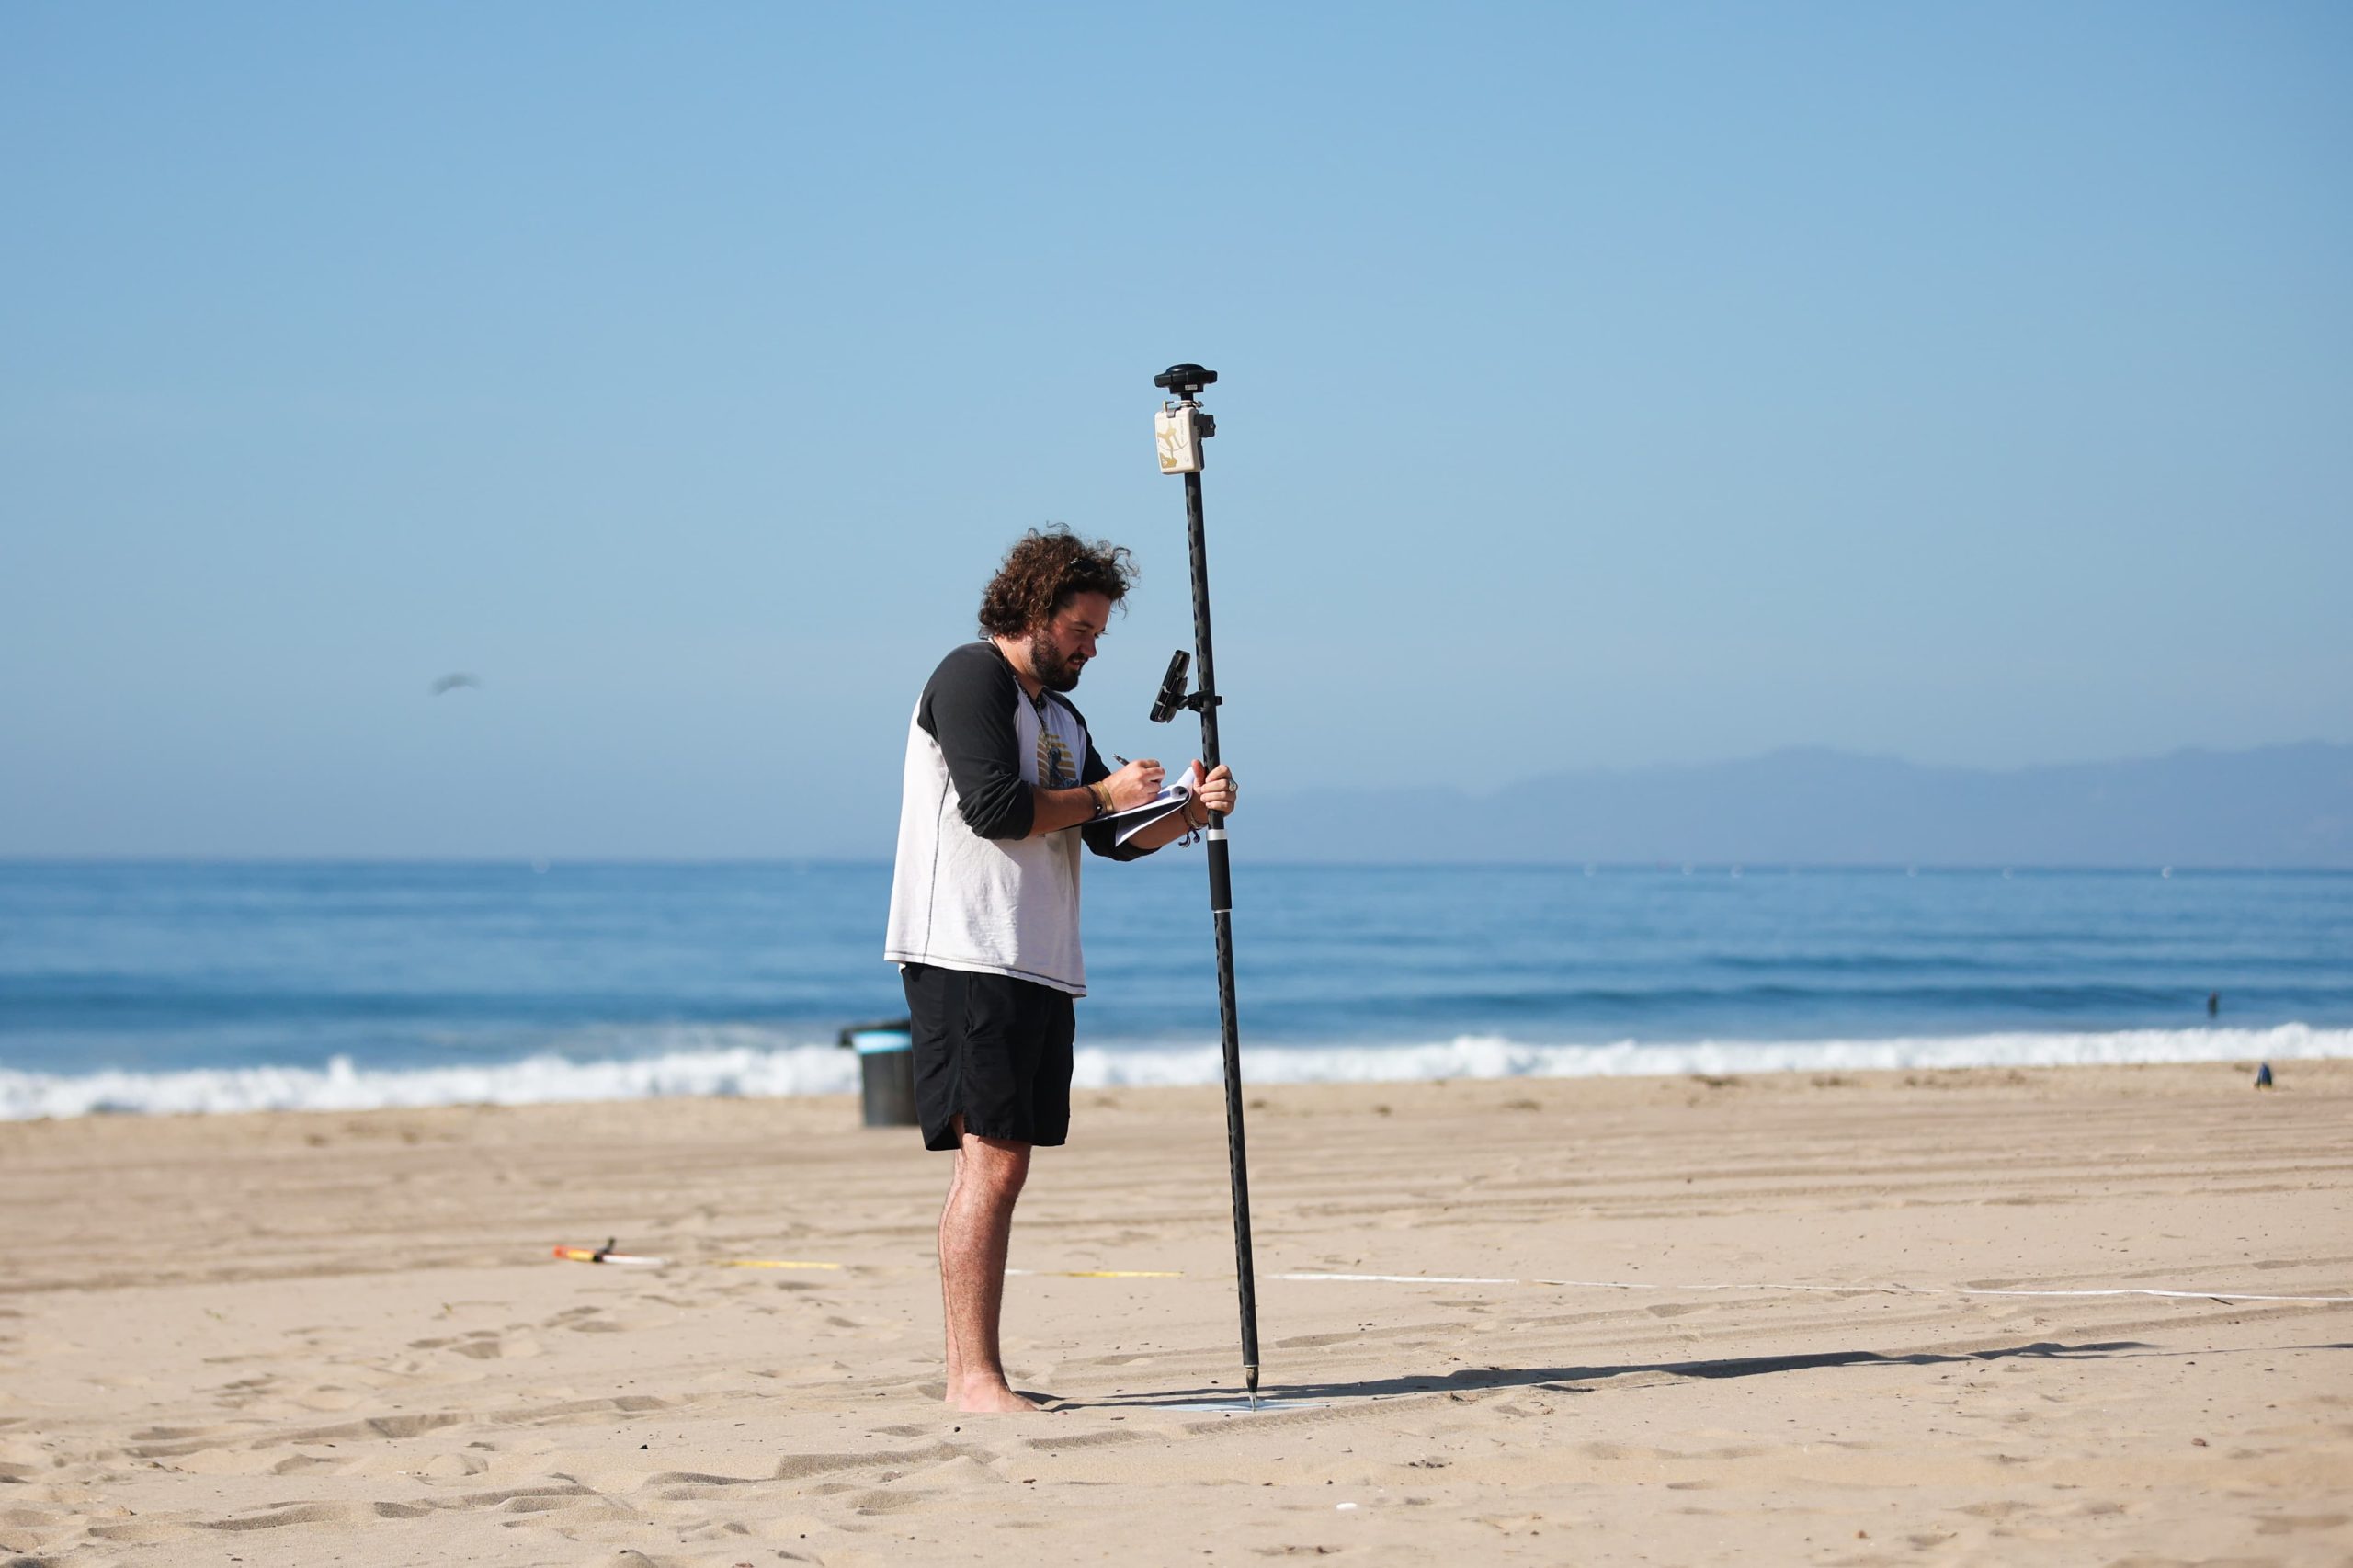
With drone data captured, the researcher completes the visit with a traditional ground survey to identify additional features.
Boots-On-The-Ground Beach Surveying
Ideally, we’re going to try to tease apart the seasonal changes. Maybe dunes will grow a lot in the spring when it’s the windiest here, or we’ll be able to attribute erosion and the most negative change during our winter storms
The ground survey targets the measurement of many of the same beach and dune characteristics. The researchers identify, map, and measure the position and elevation of the foredune, for instance, as this feature is an important barrier between the land and sea. They measure the foredune’s
- Highest elevation point (“crest”)
- Lowest elevation point toward the sea (or “toe”)
- Lowest elevation point toward the land, or behind the dune (a trough)
“Ideally, we’re going to try to tease apart the seasonal changes,” Emery said. “Maybe dunes will grow a lot in the spring when it’s the windiest here, or we’ll be able to attribute erosion and the most negative change during our winter storms.”
They also set up cross-shore transects from the foredune to the sea. On the transects, they capture the position and elevation of “wrack” deposits (i.e., kelp, seagrass, driftwood, other vegetation) that washed up on the shore, the beach water table, the dune vegetation limit, and the other characteristics described above. These extra points typically yield another 40-45 data points for the site visit. Changes in these features over time can have huge implications for beach and dune ecology.
“Invertebrates eat the wrack that washes up, shorebirds nest around the wrack, use it as a wind-break and shelter, and eat the invertebrates,and the wrack can also facilitate dune formation,” Emery explained.
All of the data points are captured with the Arrow Gold+ in ArcGIS Field Maps. Later on in the office, Emery and his team can layer all data into a single map to create a 3D picture of not just each site, but also each site over time.
Scaling The Workflow
The real benefit here is that we can develop a process for extracting some of this data from satellites. We could in theory scale up to statewide methodology and researchers or managers in different locations could use this methodology.
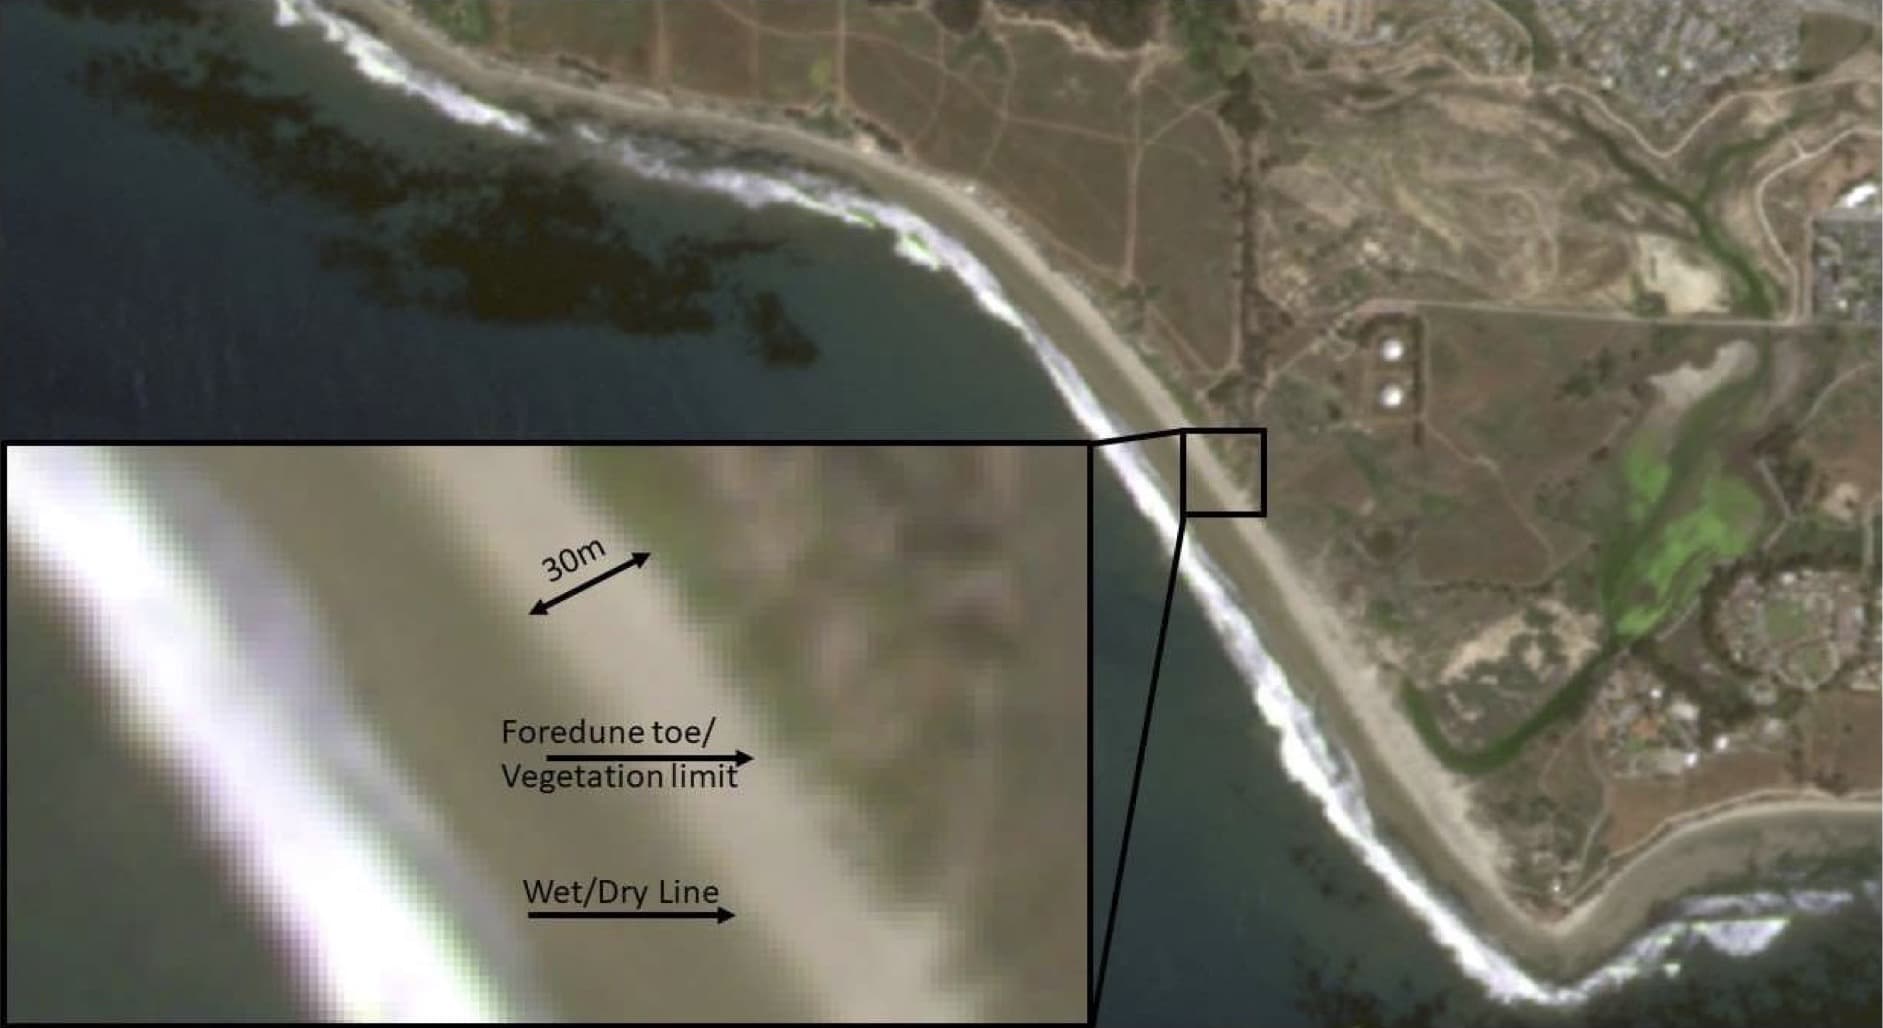
Once data is captured on the ground, the project’s next goal is to develop a method that could be used to extrapolate their measurements — as accurately as possible — along the entire California coast. To do this without undertaking the resource-heavy task of surveying the entire coast, the researchers will rely on slightly coarser yet high-resolution satellite imagery from imagery company Planet.
Available commercially, Planet’s imagery has about a three-meter-per-pixel resolution. Though the accuracy is less than surveying, the frequency of this imagery is near daily (excluding days when cloud cover and similar circumstances interfere naturally with satellite imagery capture). This makes the imagery a potential source of scaling their boots-on-the-ground observations.
To see if this is possible, Emery’s assistant Max Callahan is leading a workflow that centers around extrapolating observations from the Planet imagery by using the survey-grade site data they captured as a reference. By doing this, they hope to be able to develop a method for extending their findings to monitoring changes to beaches along the entire California coastline.
“The real benefit here is that we can develop a process for extracting some of this data from satellites,” Emery said. “We could in theory scale up to statewide methodology and researchers or managers in different locations could use this methodology.”
Beyond the Tides
Emery and his team will use the third and final year of the project to refine their data analysis, report and publicize their findings, and perform community outreach. For each of the 14 sites surveyed, Emery will conduct an educational workshop, so communities can understand the changes at their local beaches. Many of these sites are near disadvantaged communities. Emery hopes his work will help them find ways to protect their ecological and economic marine resources into the future.
Overall, Emery hopes other researchers worldwide benefit from his work. By having a method to monitor beach ecology over time at scale, the theory is that others can better predict their own local changes due to SLR.
“We can show them the process behind our study and provide a written manual for others interested in doing these types of surveys,” Emery said. “Our data will also be available to researchers for use in modeling studies and local managers for use in coastal planning purposes.”
