Want to achieve high-accuracy as-built mapping for your gas utility? Revisit this April 2022 webinar with Esri and Eos Positioning Systems to learn how to get started.
In this webinar recording, you’ll hear real-life examples of successful high-accuracy as-built deployments from Apex Utilities, Inc., and Vermont Gas Systems, Inc. After each utility presents its use case and journey, the panel of experts stays for Q&A.
Click play to launch the recording, or keep scrolling to read the transcript …
Introduction
JOE JOHNSON, ESRI: Good morning, everyone, and welcome to today’s webinar, “High-Accuracy As-Builting for Gas Utilities.” This is a joint webinar between Eos Positioning Systems and Esri.
My name is Joe Johnson and I’d like to thank you for joining us today. I’d now like to go over a few housekeeping items. We encourage questions throughout the webinar. In your webinar portal, there is a questions tab where you can ask questions at any time during this presentation. There will be a team on the backend consolidating those questions and there will be an extended Q&A session at the end. So, please make sure to ask those questions and we’ll get those answered for you.

I’d also like to bring to your attention that we have multiple handouts that you can download. There’s a resources PDF, which has extra info and resources that our speakers will discuss. And two case studies — one from each of our customers presenting today.
Finally, this webinar will be recorded and will be available in two to three weeks. At this time, I’d now like to introduce our four main speakers.
Tom Coolidge, Esri
First off, we have Tom Coolidge. Tom is Esri’s Gas Utility and Pipeline Director. In this role, Tom oversees Esri’s outreach efforts to all natural-gas gathering, transmission, and distribution companies. Tom is also responsible for thought leadership, community building, research, and the identification of industry solution needs. Welcome, Tom.

James Cunningham, Vermont Gas Systems
Next, we have James Cunningham. James is the GIS Administrator at Vermont Gas Systems, located in South Burlington, Vermont, where he’s been for eight years. As the first GIS employee hired at Vermont Gas, James has been instrumental in growing geospatial technology. He has deployed mobile GIS solutions and expanded the GIS user base at the small natural gas utility to over 100 users. Welcome, James.

Mathew Desbiens, Apex Utilities, Inc.
The next speaker will be Mathew Desbiens. Mathew is the GIS Manager at Apex Utilities in Alberta, Canada, where he is responsible for the administration and development of GIS asset management systems and GPS data collection applications. Mathew has over 15 years of experience in the GIS industry, 10 years in gas utilities, and a strong background in a wide range of geospatial-related technologies. Welcome, Mathew.

Jean-Yves Lauture, Eos Positioning Systems
Last but not least, we have Jean-Yves Lauture. Jean-Yves is the CTO of Eos Positioning Systems, an Esri Gold Partner and the Canadian manufacturer of Arrow GNSS hardware and solutions. Jean-Yves is credited with creating the world’s first centimeter-level accurate Bluetooth® GNSS receiver that works with iOS®, Android™, and Windows® mobile devices.
Thank you, all of you, for joining us today.

Agenda
Next, I’d like to go over today’s agenda. I’ve already gone over the welcome and introductions. I will now pass the mic over to Tom Coolidge. He will discuss what’s new in the gas industry. After Tom, you’ll hear how James digitally transformed data collection at Vermont Gas, and then we’ll get a brief GNSS update from Jean-Yves. Finally, we’ll learn how Mathew helped Apex Utilities deploy a powerful tracking and traceability workflow. After that, all the presenters will rejoin us again for an extended Q&A period.
With that, I’d like to go ahead and pass the mic over to my colleague Tom Coolidge.
What’s New in the Gas Industry?
TOM COOLIDGE, ESRI: Hey Joe. Thank you very much, and thanks to Eos for allowing us to join in today’s presentation. We really appreciate it.
So, what’s new in the gas industry? Well, for those of you who know me, you’ll know that the thing I love most about my job is the opportunity to get out and spend time with customers and see the awesome work they’re doing with our technology and the technology of partners such as Eos. I learn a whole lot during these conversations, but a common thread to almost all of them is the urgency gas utilities are feeling today to improve their regulatory compliance and improve their business performance. Gas utilities, like everybody else, understand that there are basically two ways to do this; you either work harder or smarter.
Obviously, gas utilities can’t work much harder, and that’s evidenced in the ratio trend of customers to employees. This has been evolving for years, but if you look closely, you’ll observe that the ratio continues to climb. Gas utility employees today are increasingly expected to do more with no more and many times less.
Without high–accuracy data, a gas utility cannot achieve its potential as a high-performing gas utility.
That sharpens the focus on working smarter. Today gas utilities, more than ever, are rethinking how they best do their work. They’re actively working to optimize business processes and committing to being data-driven, both in their decision-making and their activity management. They are also committing to improving the quality and accuracy of their data. Without high-accuracy data, a gas utility cannot achieve its potential as a high-performing gas utility. And as we know, location data is arguably as important or more important than any type of data for several reasons. Location is an attribute that enables data integration, the stacking of layers which a user can work with as if they’re one. This is a great productivity and effectiveness multiplier.
The Importance of “Where”
It’s also key to “where.” This is so critical in decision-making and activity management. Think of it this way — if one of your body sensors signals that you’re having a heart attack, and you call 911 urgently for an ambulance, how would you answer when the dispatcher asks, “Where are you?”
Is it good enough to simply say, “I’m in your community,” or, “I’m in your neighborhood”? Or do you want the ambulance to know your specific street address? I’m guessing it’s the specific street address.
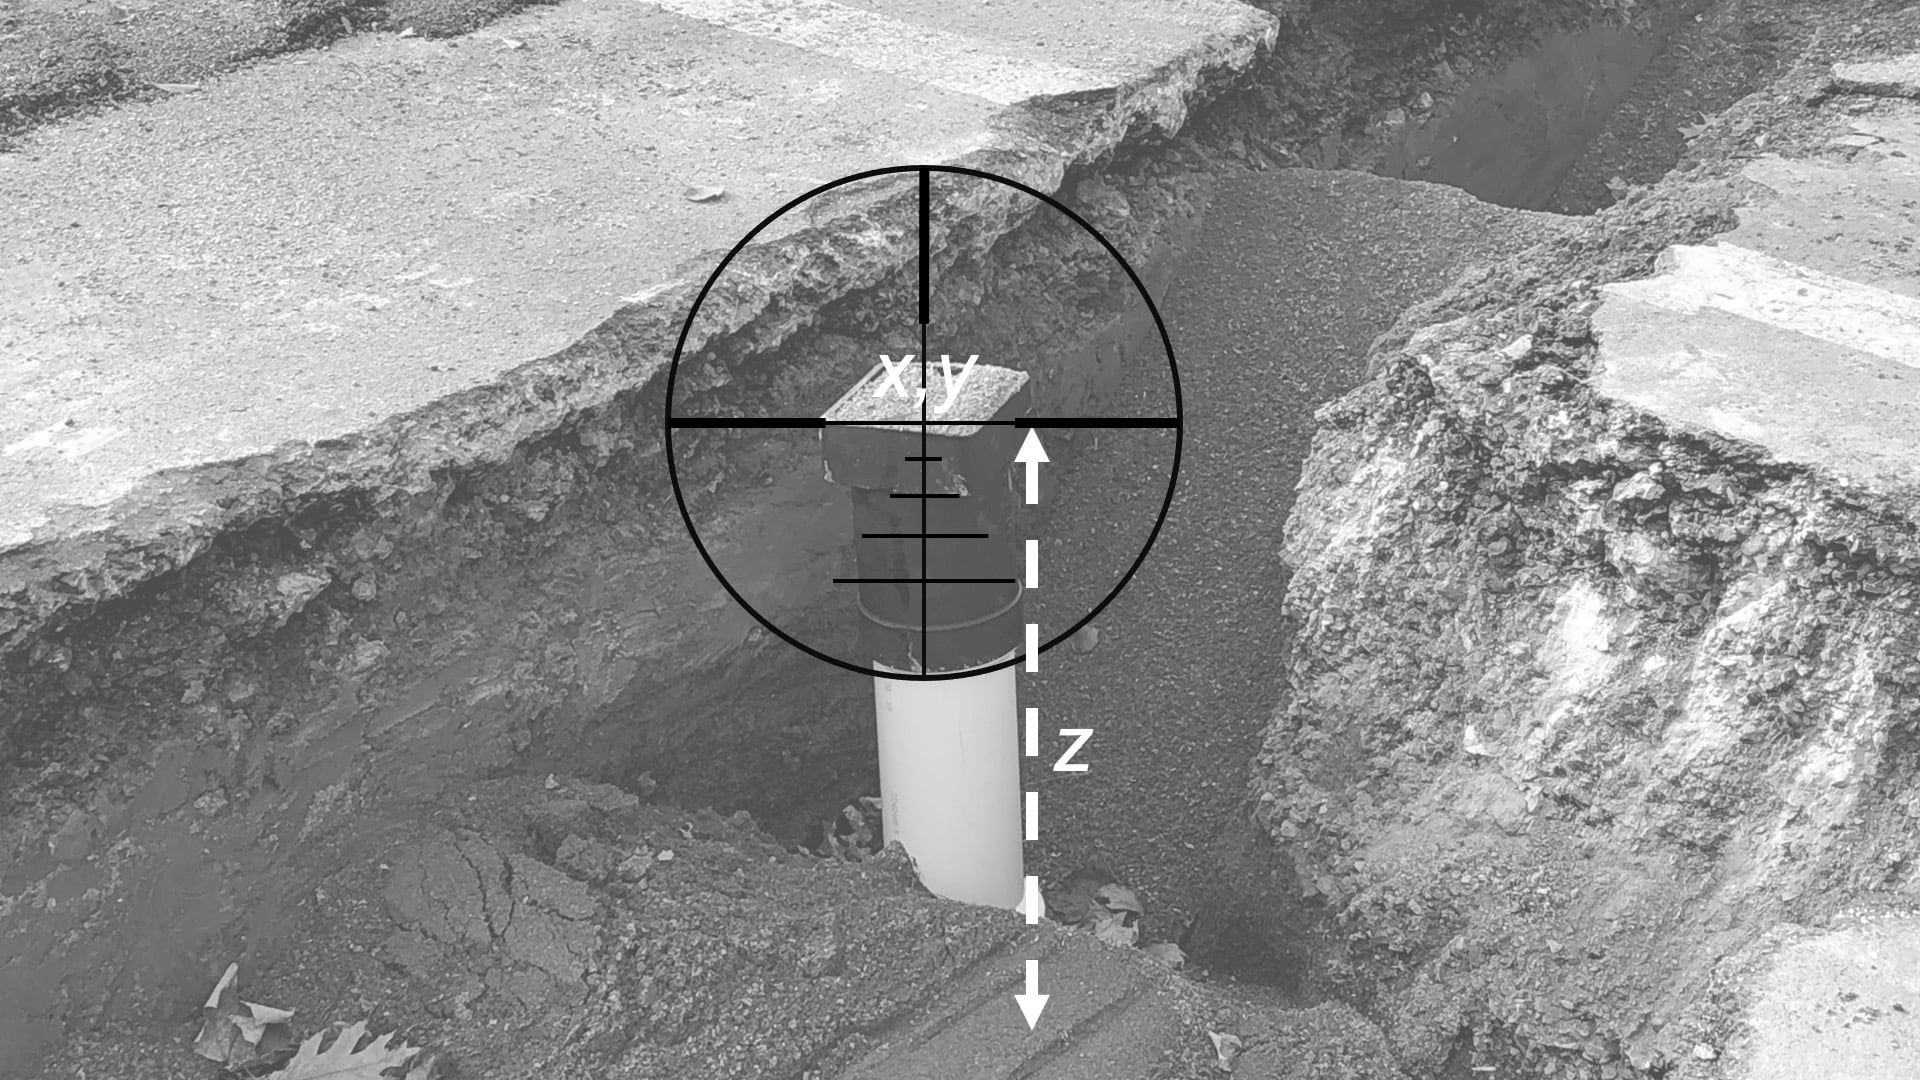
This visual reminds me, when I look at it, that, there is a very specific location for each and every one of your assets. And the more accurately you can define that location, the better prepared you are to be a high-performing gas utility. Leveraging that accuracy in everything you do. So that’s why we’re on this webinar today — more than ever, the technology exists today to allow you to capture and use high-accuracy location data. In many ways, high-accuracy data is the feedstock of high-performing gas utilities. I look forward to today’s webinar, too, because we have two really good examples. Now we’re going to transition to the first of those.
James, I turn it over to you.
From Paper to Digital: Vermont Gas Systems
JAMES CUNNINGHAM, VERMONT GAS SYSTEMS: Thanks, Tom. That was awesome. You described Vermont Gas to a T with the transition from working harder to smarter. Or, I guess, the difference between the two. I’m James Cunningham. I’m with Vermont Gas Systems.
About Vermont Gas Systems
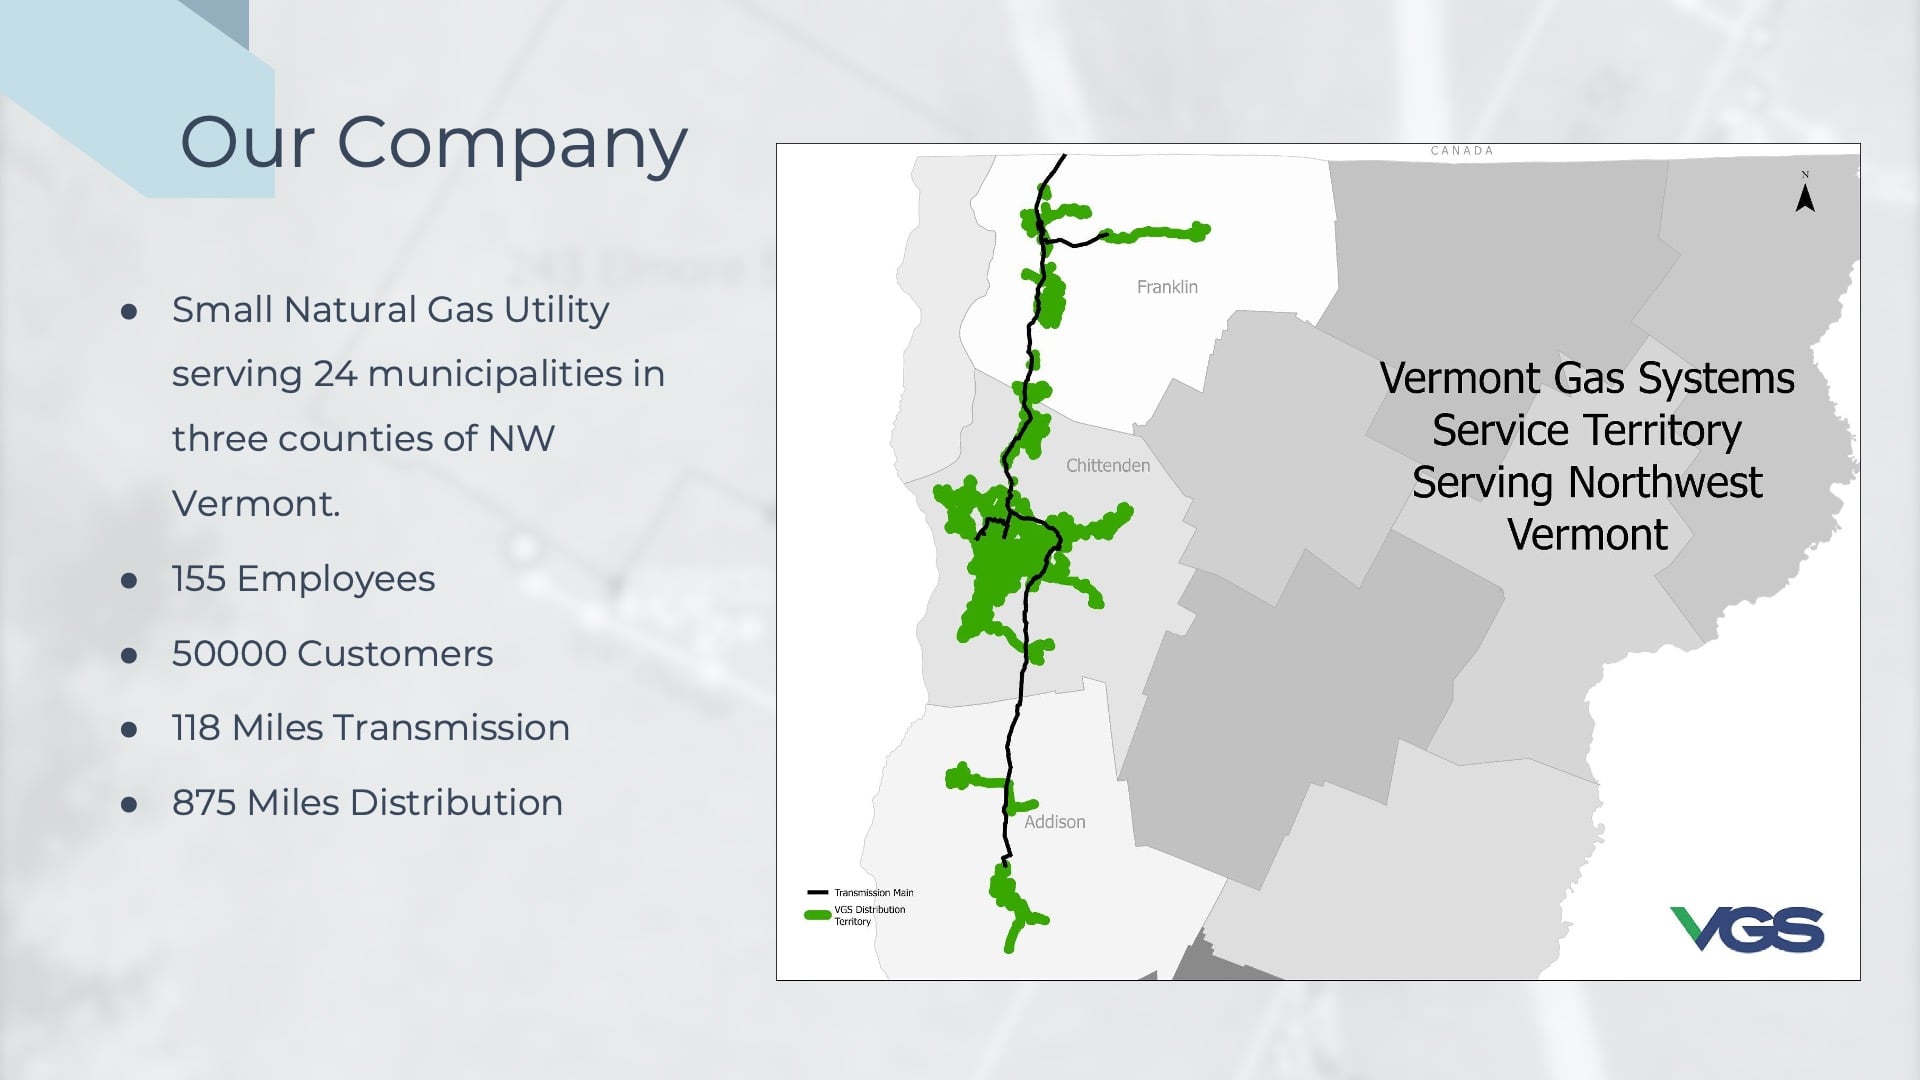
I’ll tell you a little bit about Vermont Gas. We are a small gas utility located in northwest Vermont. We have 50,000 customers and maintain a mix of transmission and distribution systems with 155 employees.
Like many gas utilities, especially small gas utilities, we’ve had a heavy reliance on paper. Our record-keeping process has always been paper for many years. We got away with it for a long time because we had a group of long-tenured employees with vast institutional knowledge who were true experts on our system and could manage that paper workflow. And like a lot of gas utilities, and as Tom alluded to, those employees are leaving the workforce, retiring, and moving on.
The Challenge: Updating a Paper-Based Workflow
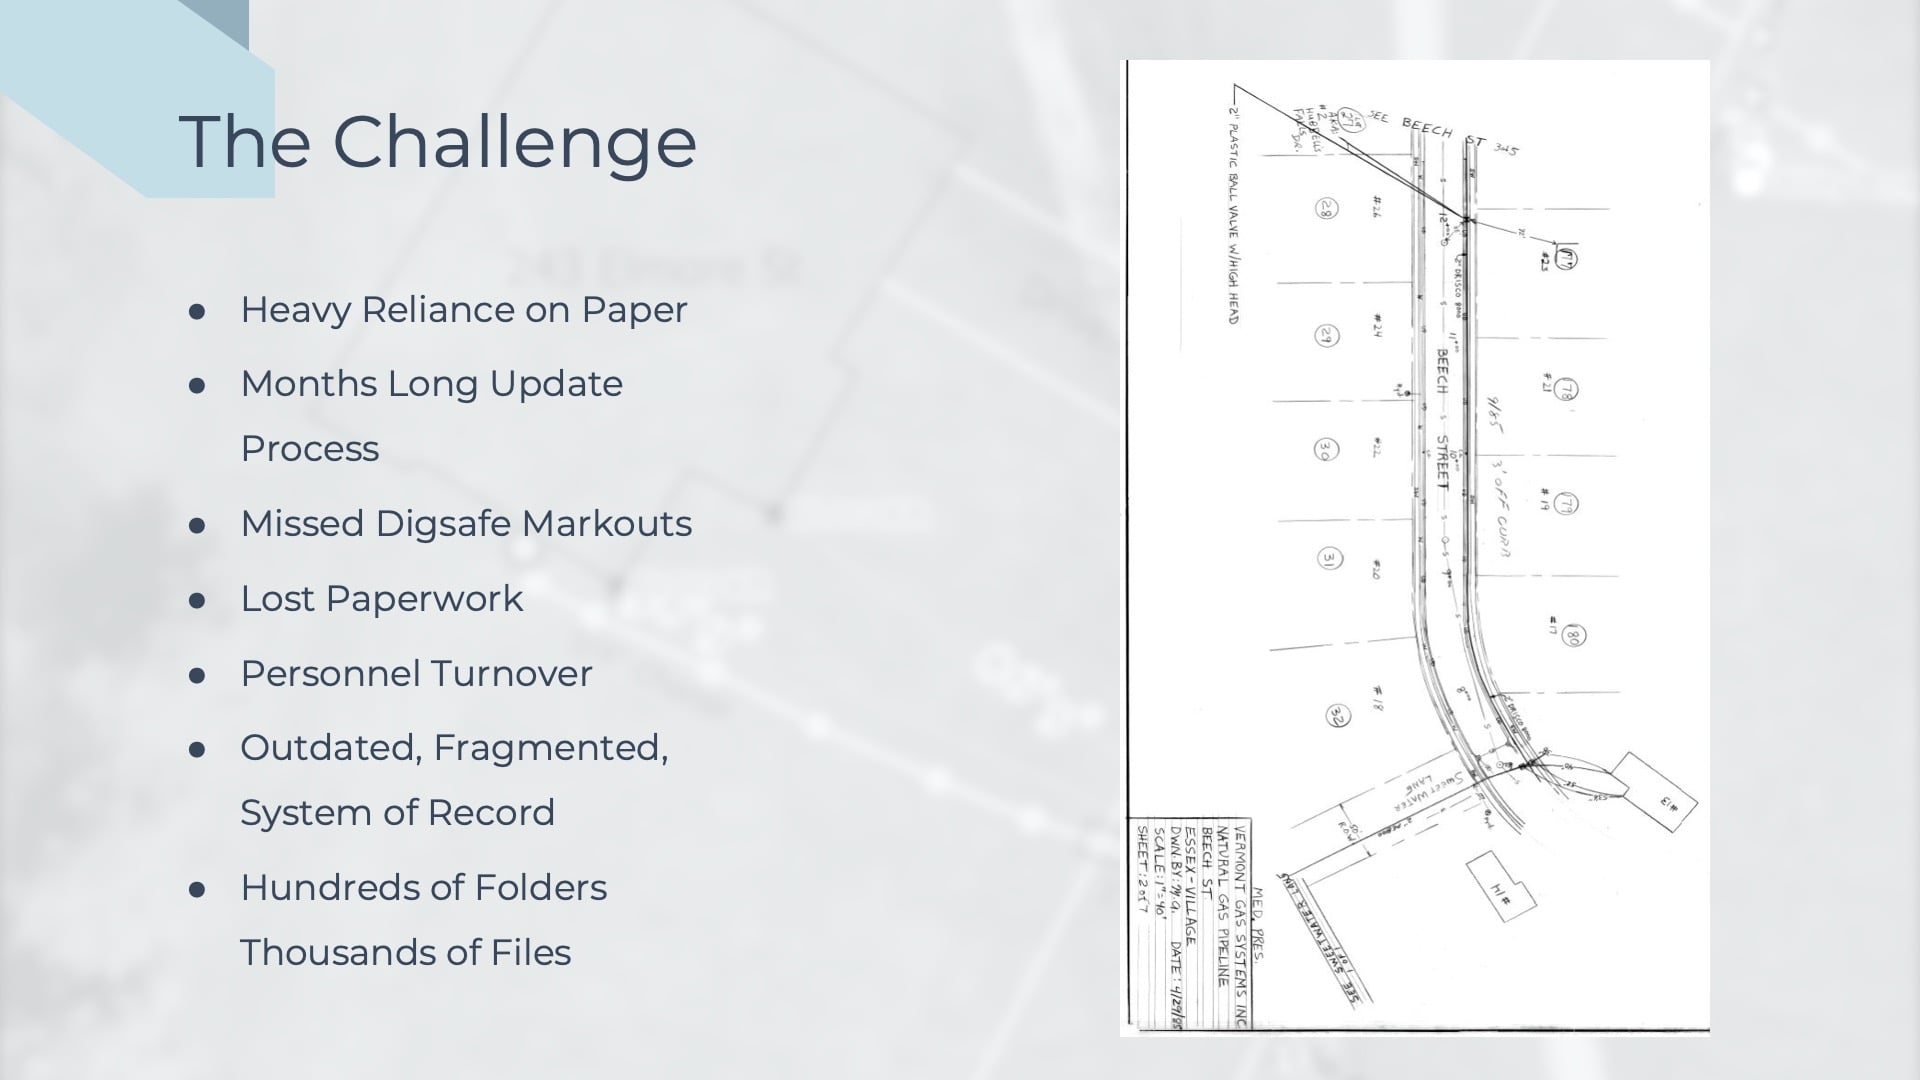
So, we as a utility had to make a decision — are we going to get better at paperwork, or are we going to get better at technology? What’s going to fill that vacuum for the folks who are leaving our workforce, who really built this system and built the record-keeping system behind it. So, the previous slide was a pretty indicative snapshot of our system. There were thousands and thousands of files making up tiny little snapshots with detailed hand drawings, which are hard to manage, and it’s really hard to update.
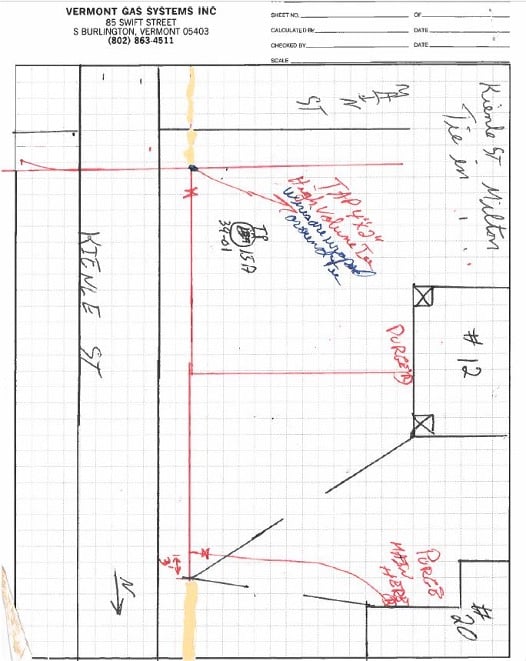
Here you can see an example of some of our field notes that we would have to turn into a system of record — turn it into hand drawing, or CAD drawing, or later GIS data. Using field notes like this is a daunting task, and without that really vast institutional knowledge, it was almost impossible to do accurately.
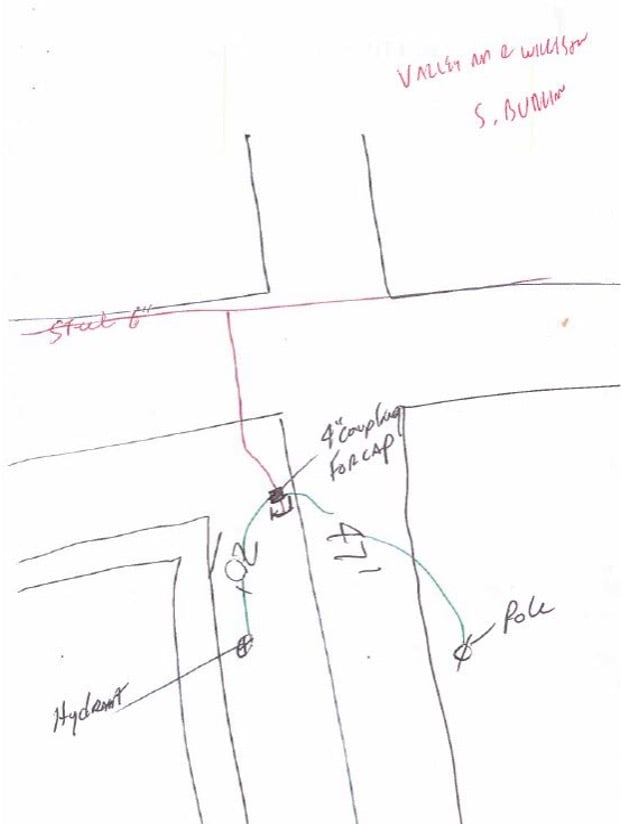
Here’s another example. You can see we’re missing all kinds of information on this. Not only accuracy information, but materials, work order numbers — things that we really need to comply with our regulators and to give us a really good snapshot of our system and where things are located so we can keep it safe.
The Solution: Digital Transformations with GIS Data
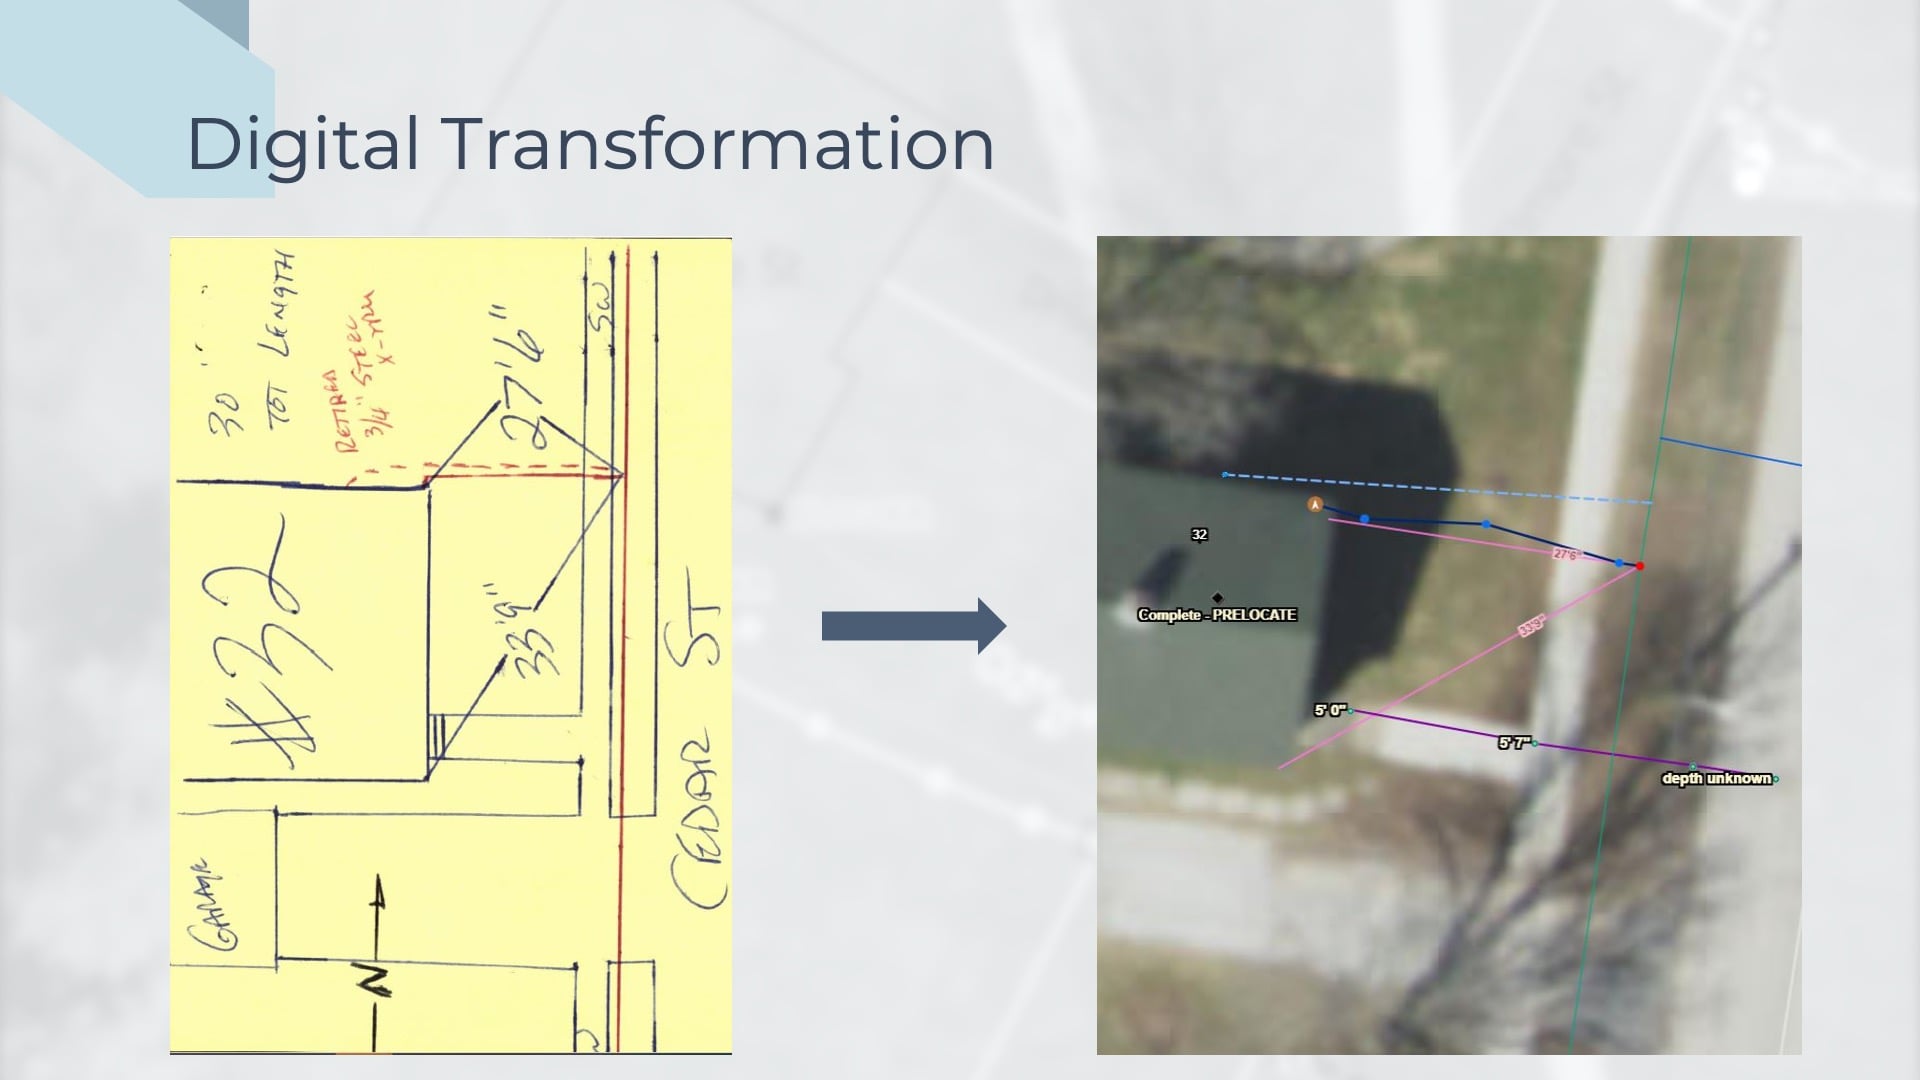
What we really needed was a digital transformation of the workflow. You can see here, this is one of our old service cards with a kind of digital twin on the other side. So, folks who are really used to using the old service cards can still get all the information they need, things like swing ties and other little information. They can get all that from the GIS, plus more. There’s more data behind it. With GIS, they can click on a point and understand when it was installed and understand the accuracy behind it; there’s a vast amount of data we can add to the digital process.
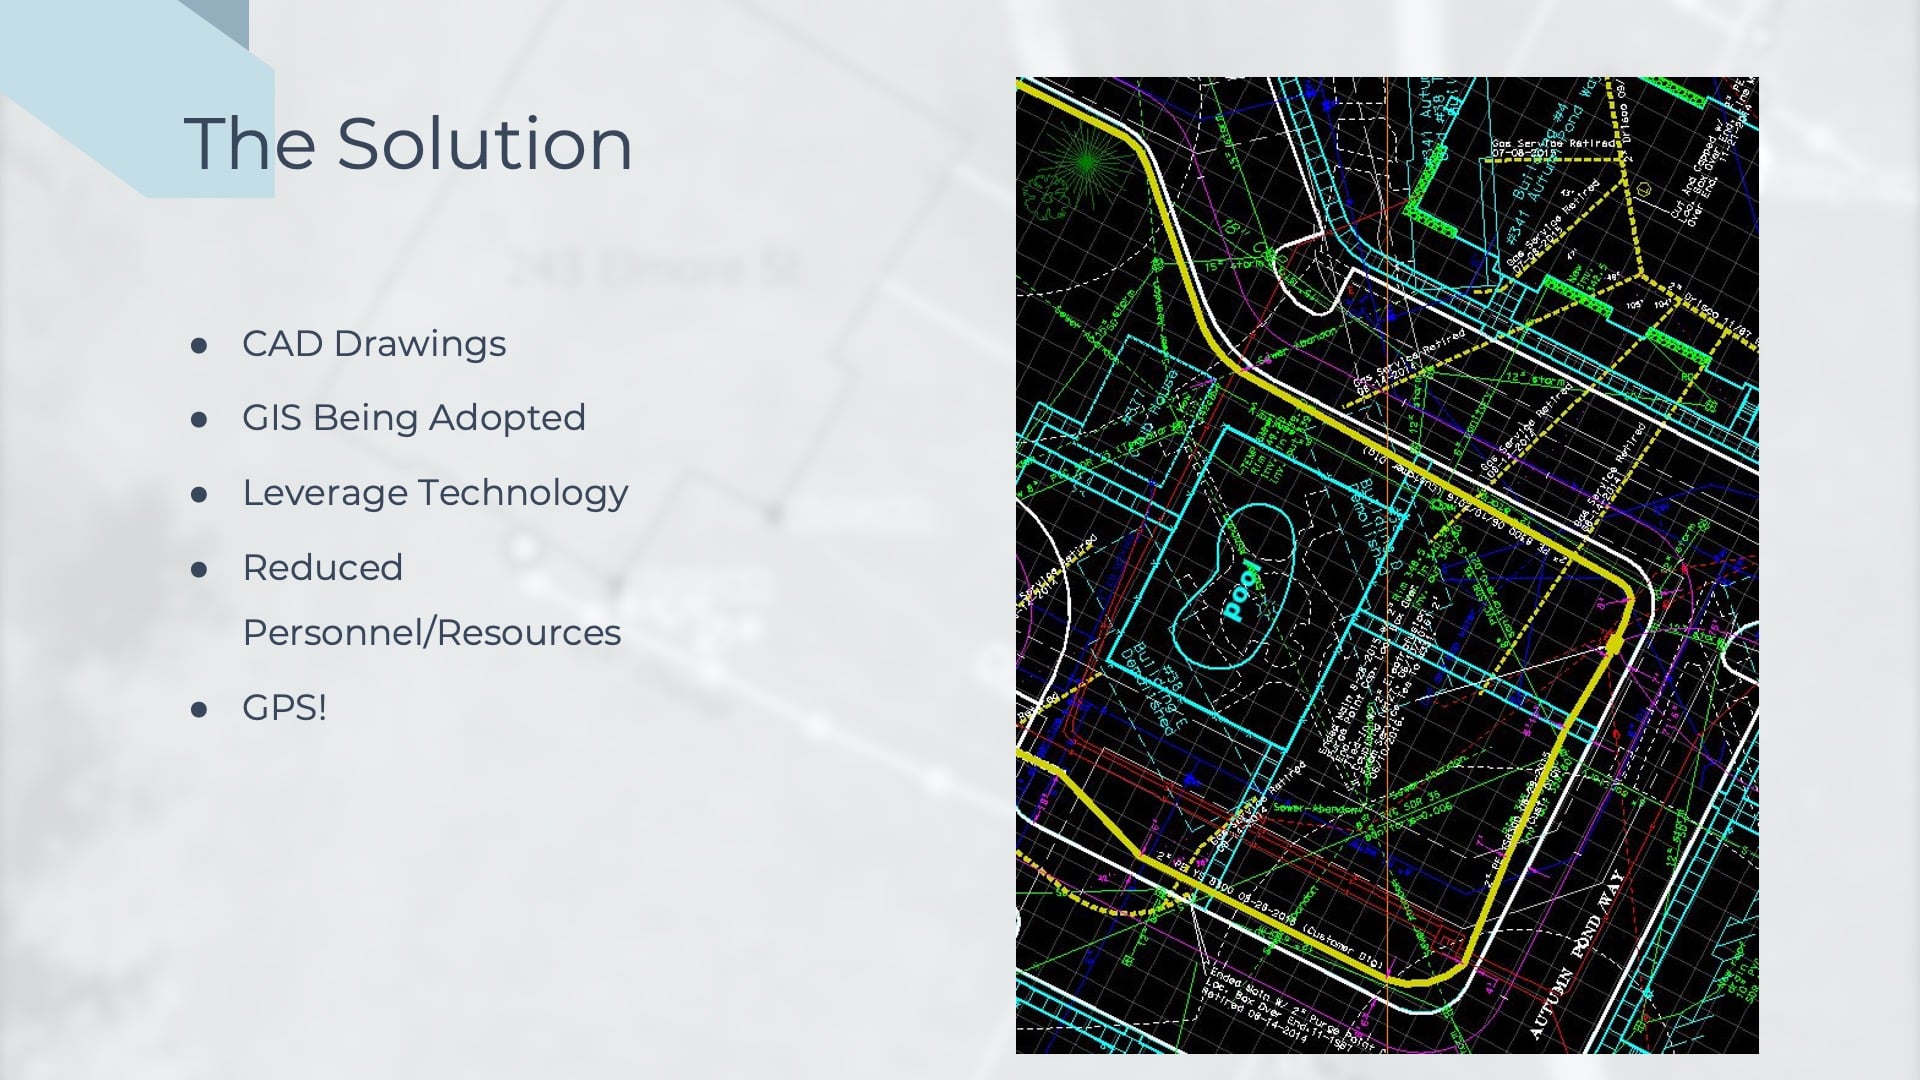
And this started quite a while ago. The digital transformation started 20-some-odd years ago with CAD drawings. CAD was a nice upgrade over hand drawings; the drawings were a little more aesthetically pleasing, and a little better to work with, but they didn’t really solve any problems as far as efficiency went. When folks needed to access this information, they were often still printing it out. It was really no easier to update — they were still using those same field construction notes that I showed in some of those previous slides, to update these CAD drawings. So, over the course of a construction season, a big stack of papers would pile up and they’d use those field notes to create the system of record in the off-season. So, it was often months before a new installation or a moved piece of pipe, etc., was rectified in our system of record.
GIS: The “Nervous System” of Utilities
We really needed that digital transformation that was the next level up, and GIS is obviously that. GIS is the nervous system of a utility — it allows you to search for your assets, it allows you to filter things, it allows you to look at your system and really find granularity, even from 10,000 feet. It allows for better analysis and smarter decision-making.
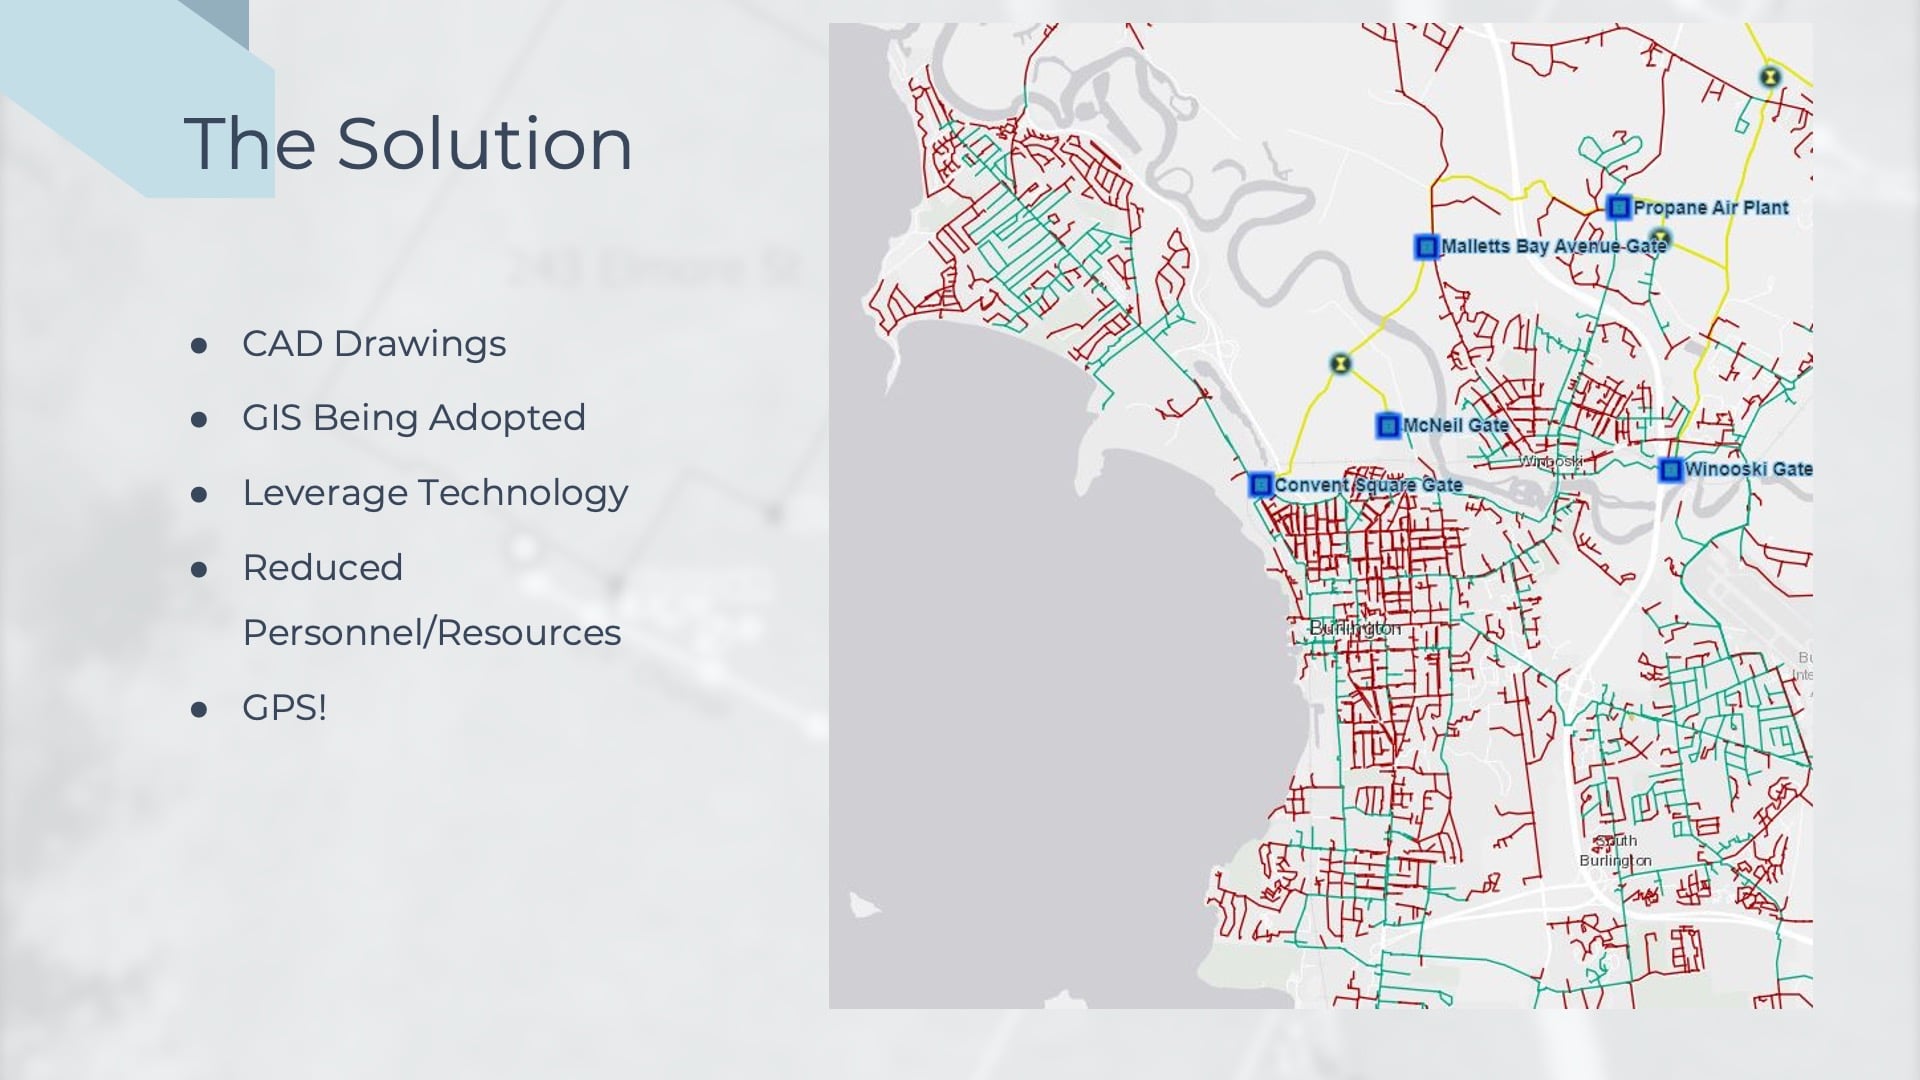
The industry was moving in that direction; leaders at Vermont Gas saw this and about 10 years ago started to invest in moving in that direction. Eight years ago, I was hired as the first GIS person at the company. The GIS database that I inherited was built by teams of interns, each with different attention to detail and different understandings of the gas systems. So, it was a raw database that was missing a lot of data. The accuracy wasn’t where we needed it to be so we could share it. To get this GIS to a point where we could use it and start making decisions and, more importantly, start sharing it with our folks in the field, we needed to do a lot of cleanup.
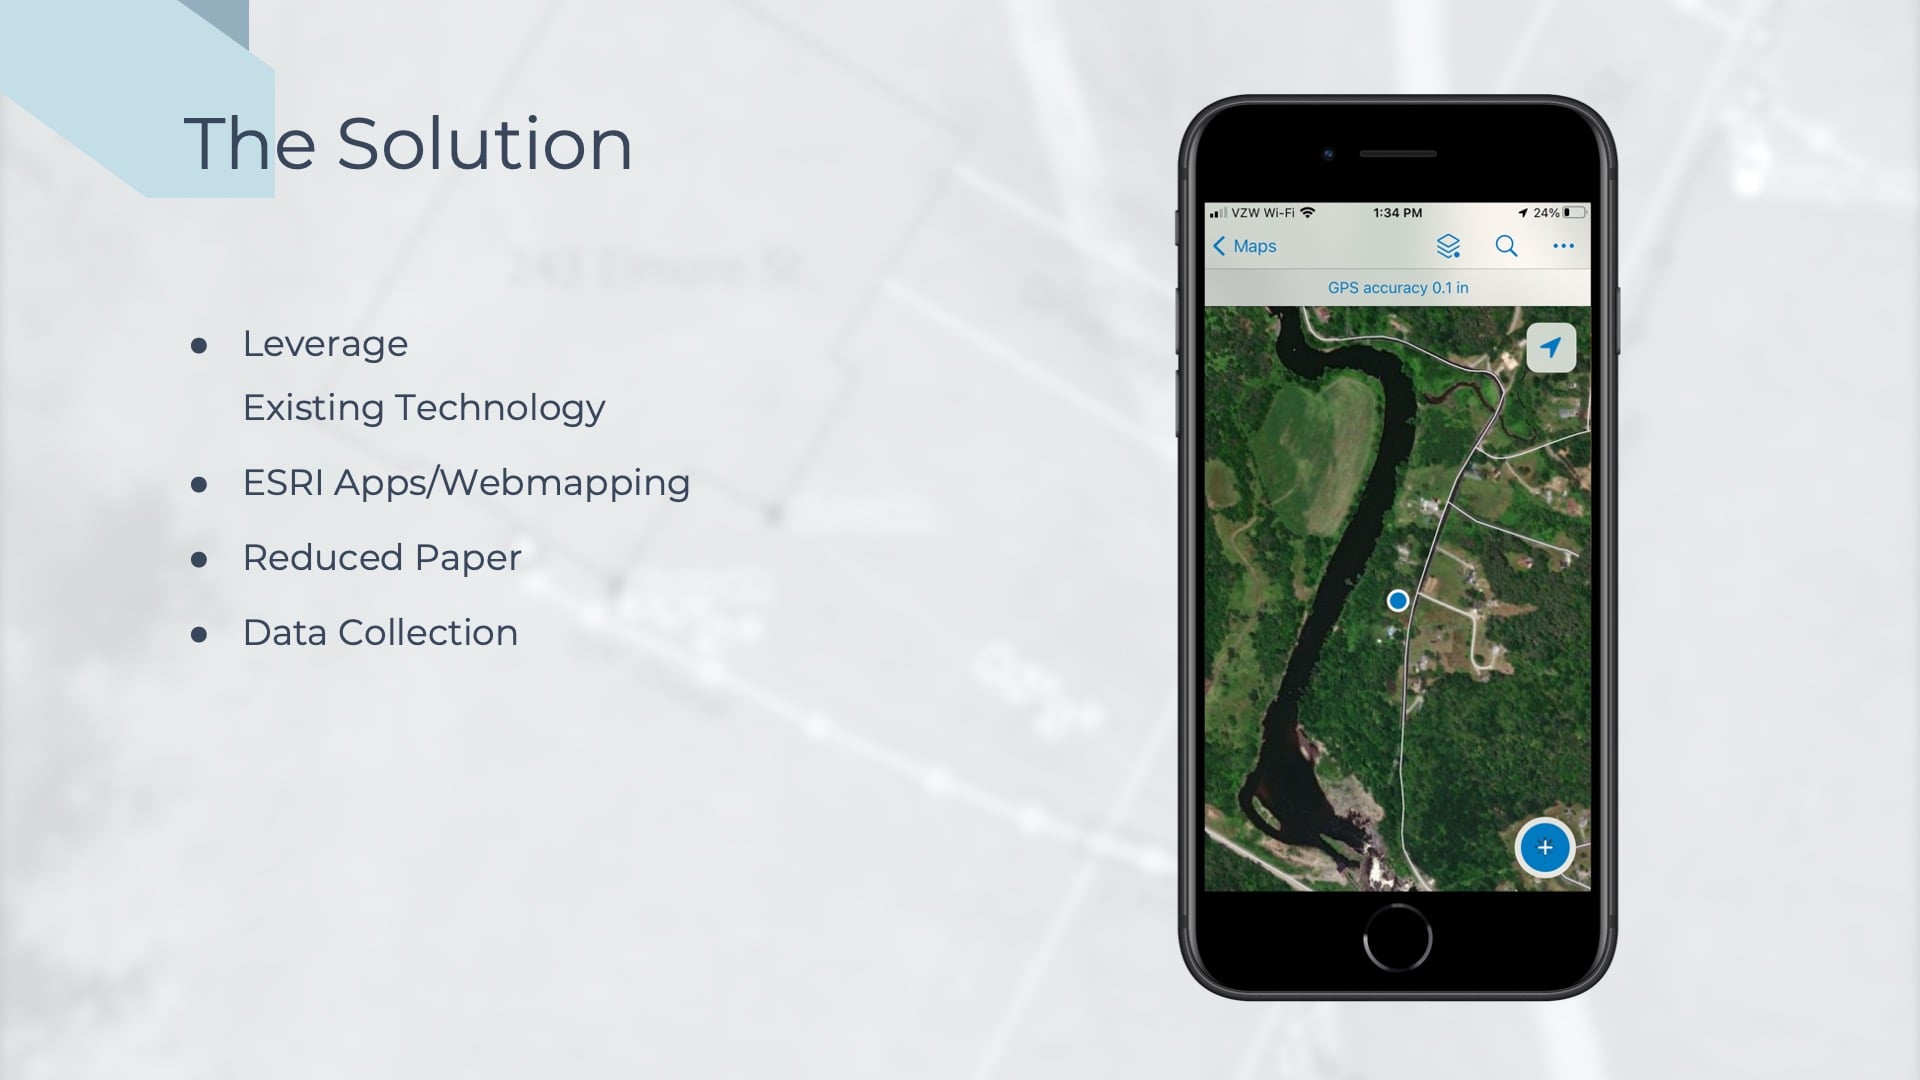
In the first three or four years of my time at Vermont Gas was doing just that. I was combing through the old hand drawings, the old pressure test records, old work orders, and old scanned field notes that I displayed earlier. I wanted to build this database into something that we could start sharing out with our folks and build a web mapping system leveraging Esri’s ArcGIS® Field Maps (previously ArcGIS Collector and ArcGIS Explorer). Nothing frustrated me more than printing out a great big map for somebody who had a smartphone in their pocket or printing out a giant PDF booklet of valves or something for somebody who had all the technology they needed to consume the data we were editing, creating, and maintaining right in their pockets. That was the big push I had when I first got hired, was to get the data reliable and usable and then start improving on it.
It wasn’t safe to leave that much of our system unrecorded anywhere other than a folder on someone’s desk all winter.
What was really slowing me down was keeping up with new construction and new maintenance during the construction season. I couldn’t let a big stack of paperwork build up and then turn that into GIS data in the middle of the winter, when construction slowed down. It wasn’t safe to leave that much of our system unrecorded anywhere other than a folder on someone’s desk all winter. We needed to make that priority number one, at least at that time. I was still a one-person GIS department, so I had to really walk that balancing act between getting new data, making sure that it was good, and also looking back and cleaning up old data, which is always a battle for GIS departments. There’s always continual improvement and QA [quality assurance] that can take place on a GIS database. Doing all of that in the winter, it just wasn’t for us, and it just wasn’t the safest way to do things. It was cutting into my ice fishing season, and it was one of the first things I really had to change once we got the GIS system built up and usable.
It made sense to make the field folks the folks who collected the data and helped us maintain the data. We wanted to make them active participants in the GIS department — rather than just end-users.
I had to turn to our field folks, who are experts in our system. We trust them completely when it comes to our gas system, so it made sense to make them the folks who collected the data and helped us maintain the data. We wanted to make them active participants in the GIS department rather than just end-users.
The Solution: Finding the Right GIS / GNSS Solution
So, we tested out a handful of different GPS units — different degrees of accuracy, different softwares, different off-the shelf software — and we consumed a lot of demos. It was tough to find the right fit for us.
The GIS
Folks were already really gaining an understanding of Esri’s apps such as Explorer, Collector, and, now of course, Field Maps. There was an appetite to work with those apps; folks really liked using the digital GIS maps instead of digging through hundreds of different files every day to gather information about the stuff they were working on. So, they were already gaining a really keen understanding of how to interact with GIS data and how to navigate Esri’s apps. We needed to use those newfound capabilities and create a high-accuracy data collection system without any extra software or extra licensing.
The GPS
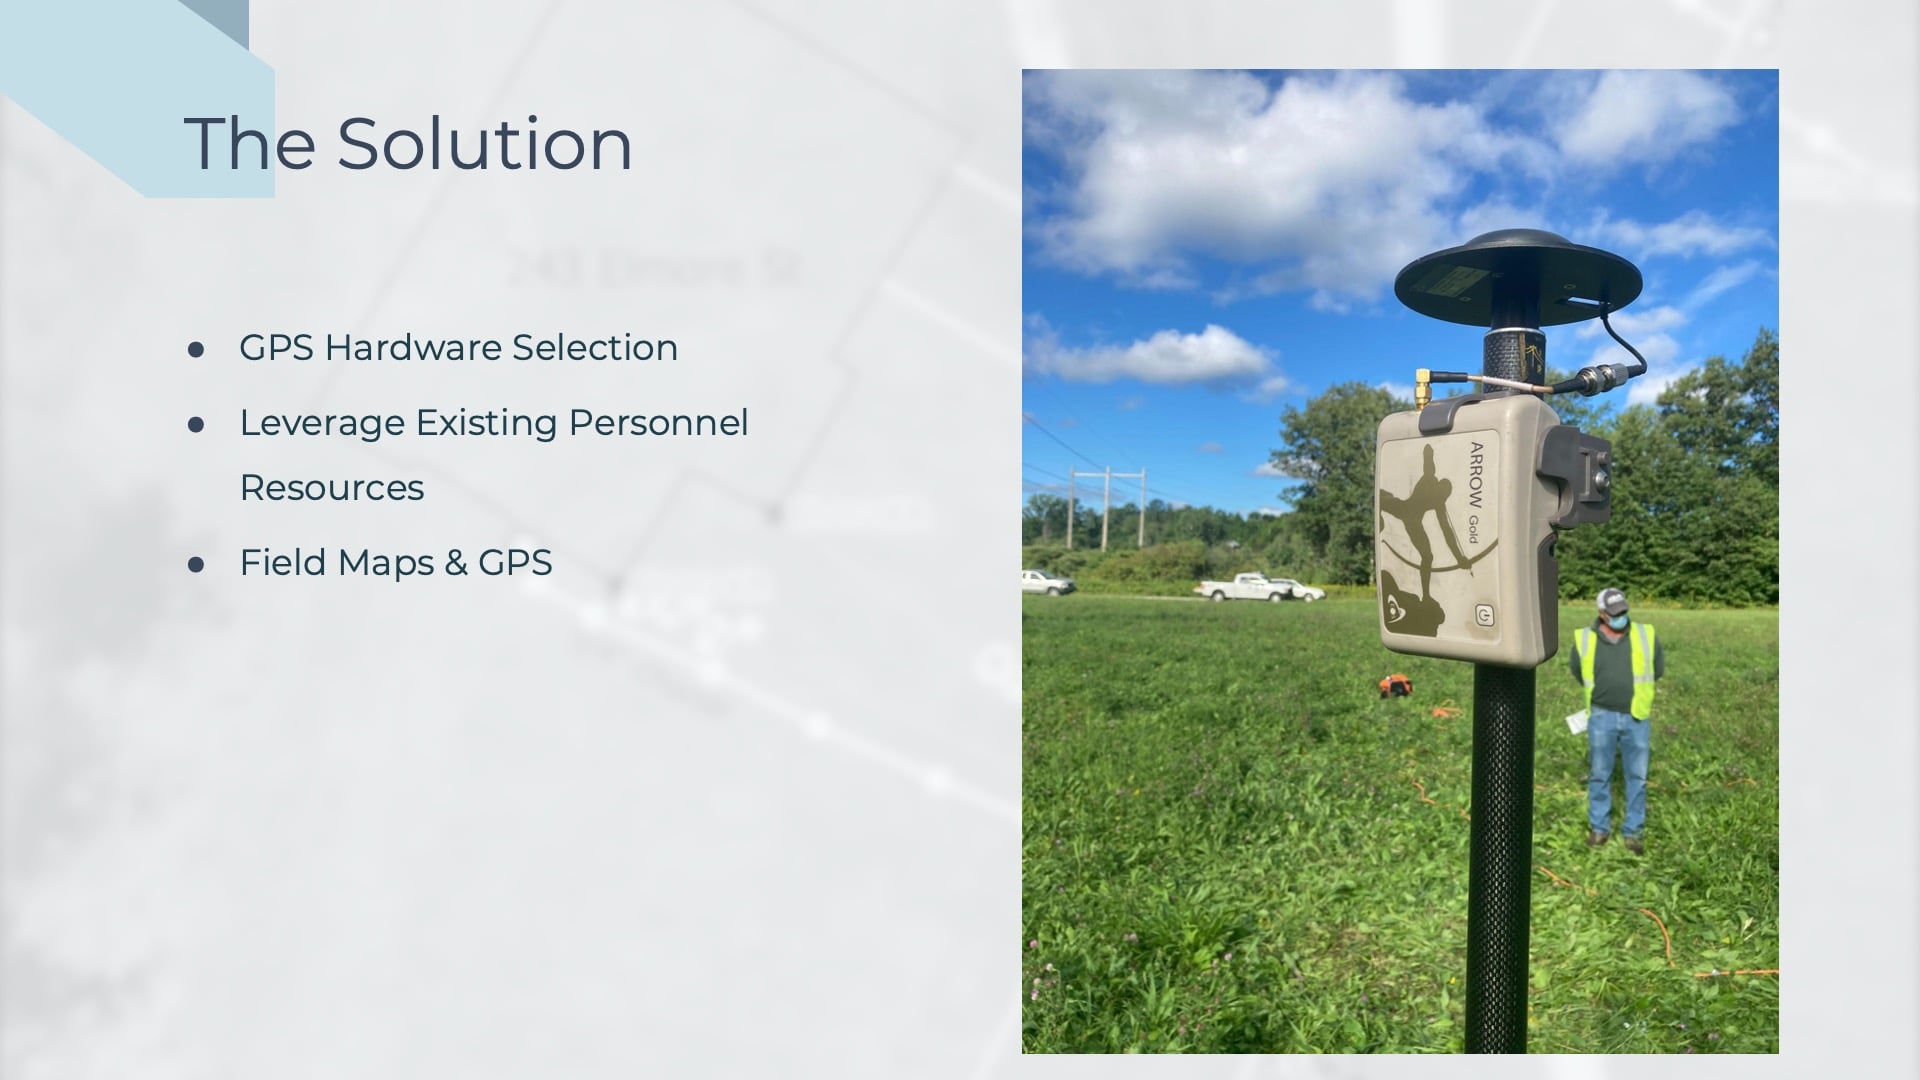
Eos was really the perfect solution. I got my hands on one of these [Eos Arrow Gold®] RTK units. Vermont, luckily, provides an RTK network as a public service to everybody. We were able to tap into that and get sub-inch accuracy using our smartphones, without a surveyor’s license or anything. Everybody could do this.
Training Personnel
The training was really easy. I was actually surprised at how easily our field team was brought up to speed. They’re [the GPS receivers] rugged pieces of equipment; we’ve had very, very few issues with the units. I bought one unit and about six weeks later I got the go-ahead to buy several more and start rolling these out quickly to our field folks. Because the benefits we were gaining were immediate — we had sub-inch accuracy on assets in real-time.
The Benefits of Real-Time High-Accuracy
If you have reliable, accurate GPS data, you can have all the confidence in the world.
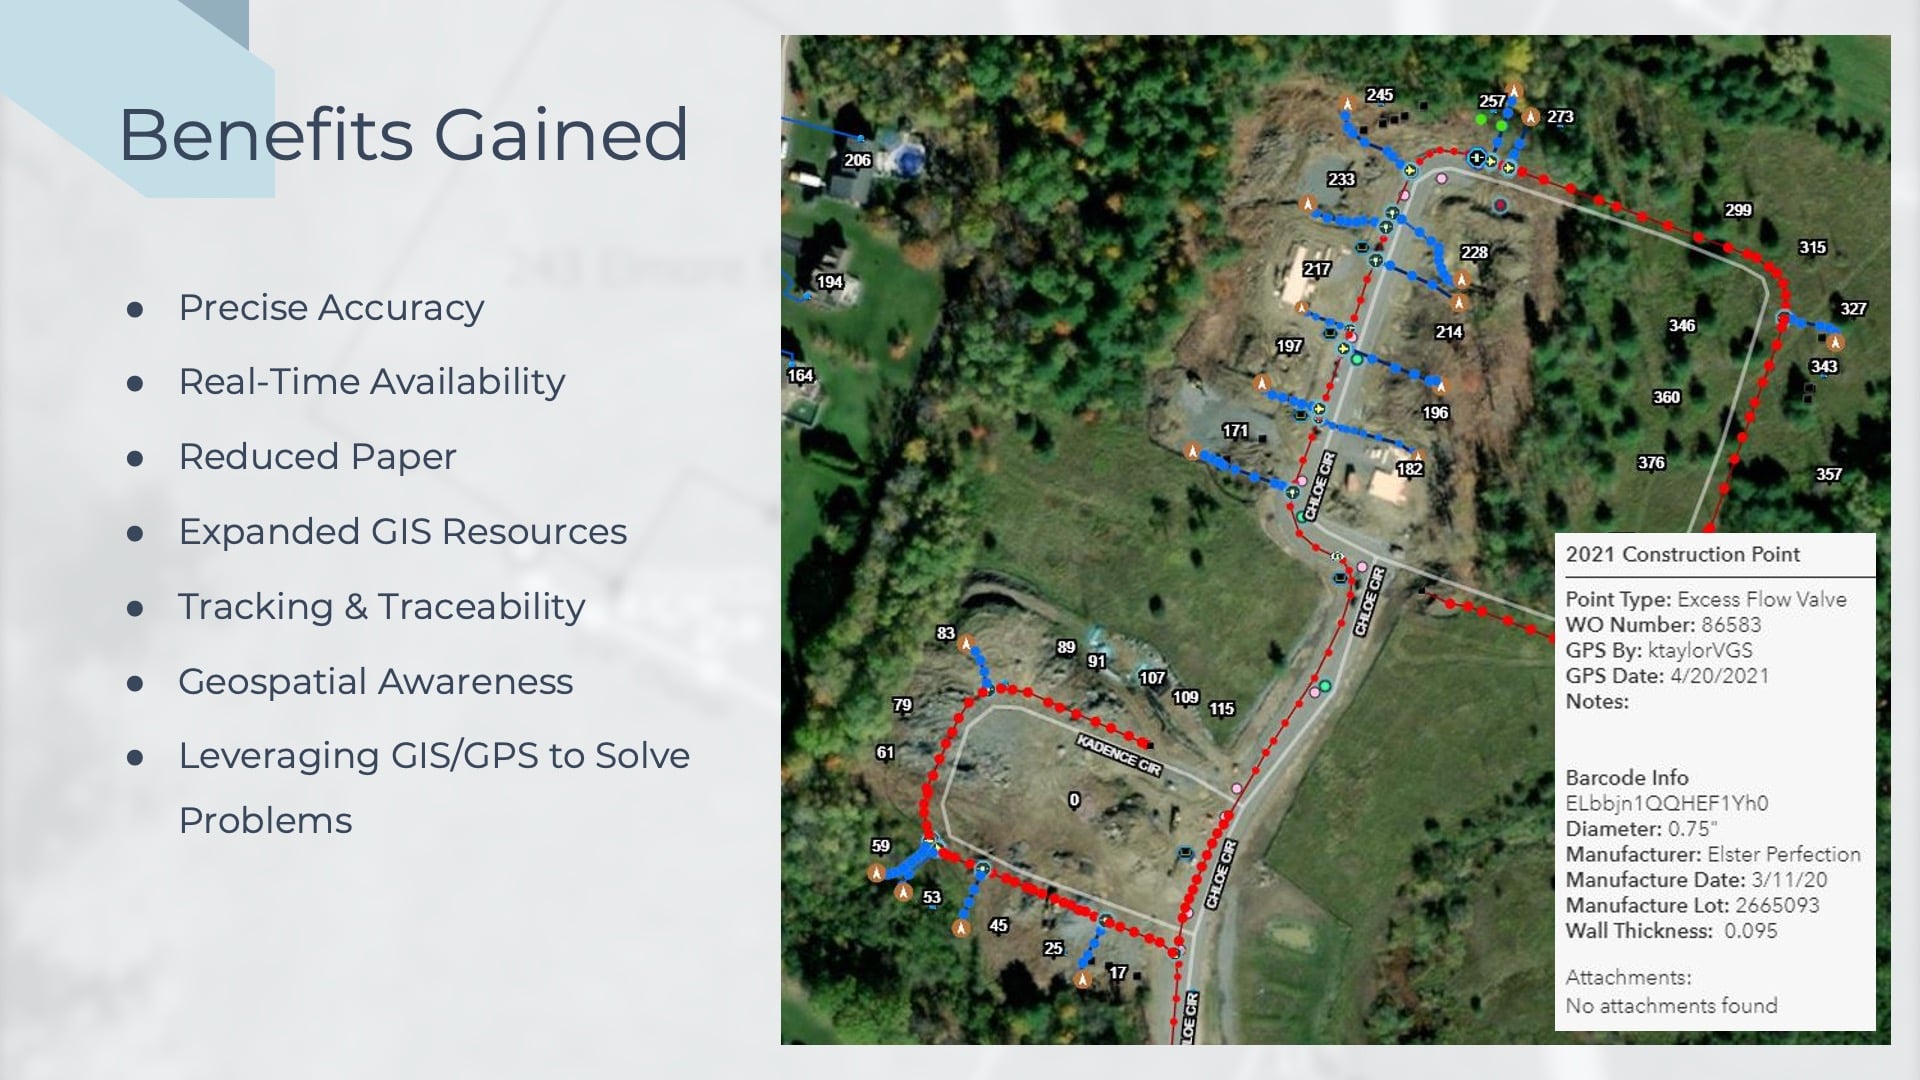
Our locators were able to work in sync with our marketing department and track what was going in the ground and when. They have real-time access to stuff when they used to have to dig through a giant stack of paper to figure out what was installed six weeks ago, or even six days ago. That accuracy and confidence we had in our system was huge. The real-time availability was one of the biggest selling points for our organization. It helped our organization to push in a new direction and move from being a pilot project or proof of concept into a production GPS shop. We were consuming large amounts of data at all times. Currently, we have eight units in the field collecting data. You can see on this screen here is one of our newer developments. We have a handful of those going up in Vermont, and we’re able to lay out that entire system with GPS. It is taking us a fraction of the time it used to take us to make record of this.
Using the high-accuracy GPS and having this high confidence level in our data, we can share it with other utilities, municipalities, and engineering firms. They rely on this data to function without interfering with our system. You know, safety is really at the core of what we do and of what I’m trying to push out to our field folks, letting them make better decisions.
Tom really hit the nail on the head with his analogy to 911, which was actually the industry I transitioned from to the gas industry. I was doing GIS work for 911 systems, and that’s the urgency I bring to locational accuracy. For example, when you need to find a T that’s leaking. or you need to find a piece of transmission pipe and you don’t have good data. If you have reliable, accurate GPS data, you can have all the confidence in the world. And that makes a huge difference.
VGS Looks Ahead to the Value of its Barcode Integration
For us, the next iteration of this is the use of barcodes. Mat from Apex is going to go into a lot more detail about tracking and traceability. But getting the barcodes on these is huge for us as well. It’s not if, it’s when we have a material failure that’s completely outside our control. For example, we’ll have to dig up a lot of service Ts. We’ve done that in the past, and we ended up having to dig up a lot more than we probably needed to because we didn’t have this barcode information. We’re currently collecting this high-accuracy data and rolling these barcodes into it and getting our staff in the field to get more comfortable with scanning barcodes. So, when we do have one of these material failures, it’s going to save us a lot of time and money in the backend of having to go out and rectify those things.
Going through this project over the past three or four years, we’ve collected more and more data. Last year we collected 95% of our new construction data with GPS units, which was 10% more than the year before that, and 10% more than the year before that. We’re trending in a good direction, and one of the byproducts of that is watching our field folks use the technology to solve problems every day.
They’re building this geospatial muscle that we never really had — it was all paper workflows before that. That was their geospatial language; that’s how they communicated to and from the office, and we’d communicate it back to them the same way. So, using this digital workflow and using the tools Esri provides, with the high-accuracy GPS units, it’s really changing that language for us.
Problem Solving with GIS: A Real-World Example of Finding Phantom Stoppers
An example of this is an issue that arose a couple of summers ago. We were doing an inline inspection of our oldest transmission line, which we hadn’t inspected in quite some time, and we had three phantom stopper fittings. I call these “phantom” because we didn’t know where they were. We had vague ideas of where they were installed 20 years ago, but we didn’t have really good information on exactly where.
We needed to dig them up and put a piece in there to allow this tool to pass by; you know, a multi-million-dollar inline inspection of a big transmission pipeline is a big deal. When you can’t get past it because you can’t find a stopper fitting, that’s an issue. We had folks in the field looking for them, and we were able to find two without too much excavation. We partnered with our local university that had a ground-penetrating radar (GPR) program, and they were able to find a couple for us. But the last one remained elusive; we knew it was installed; you can see the map on my screen.
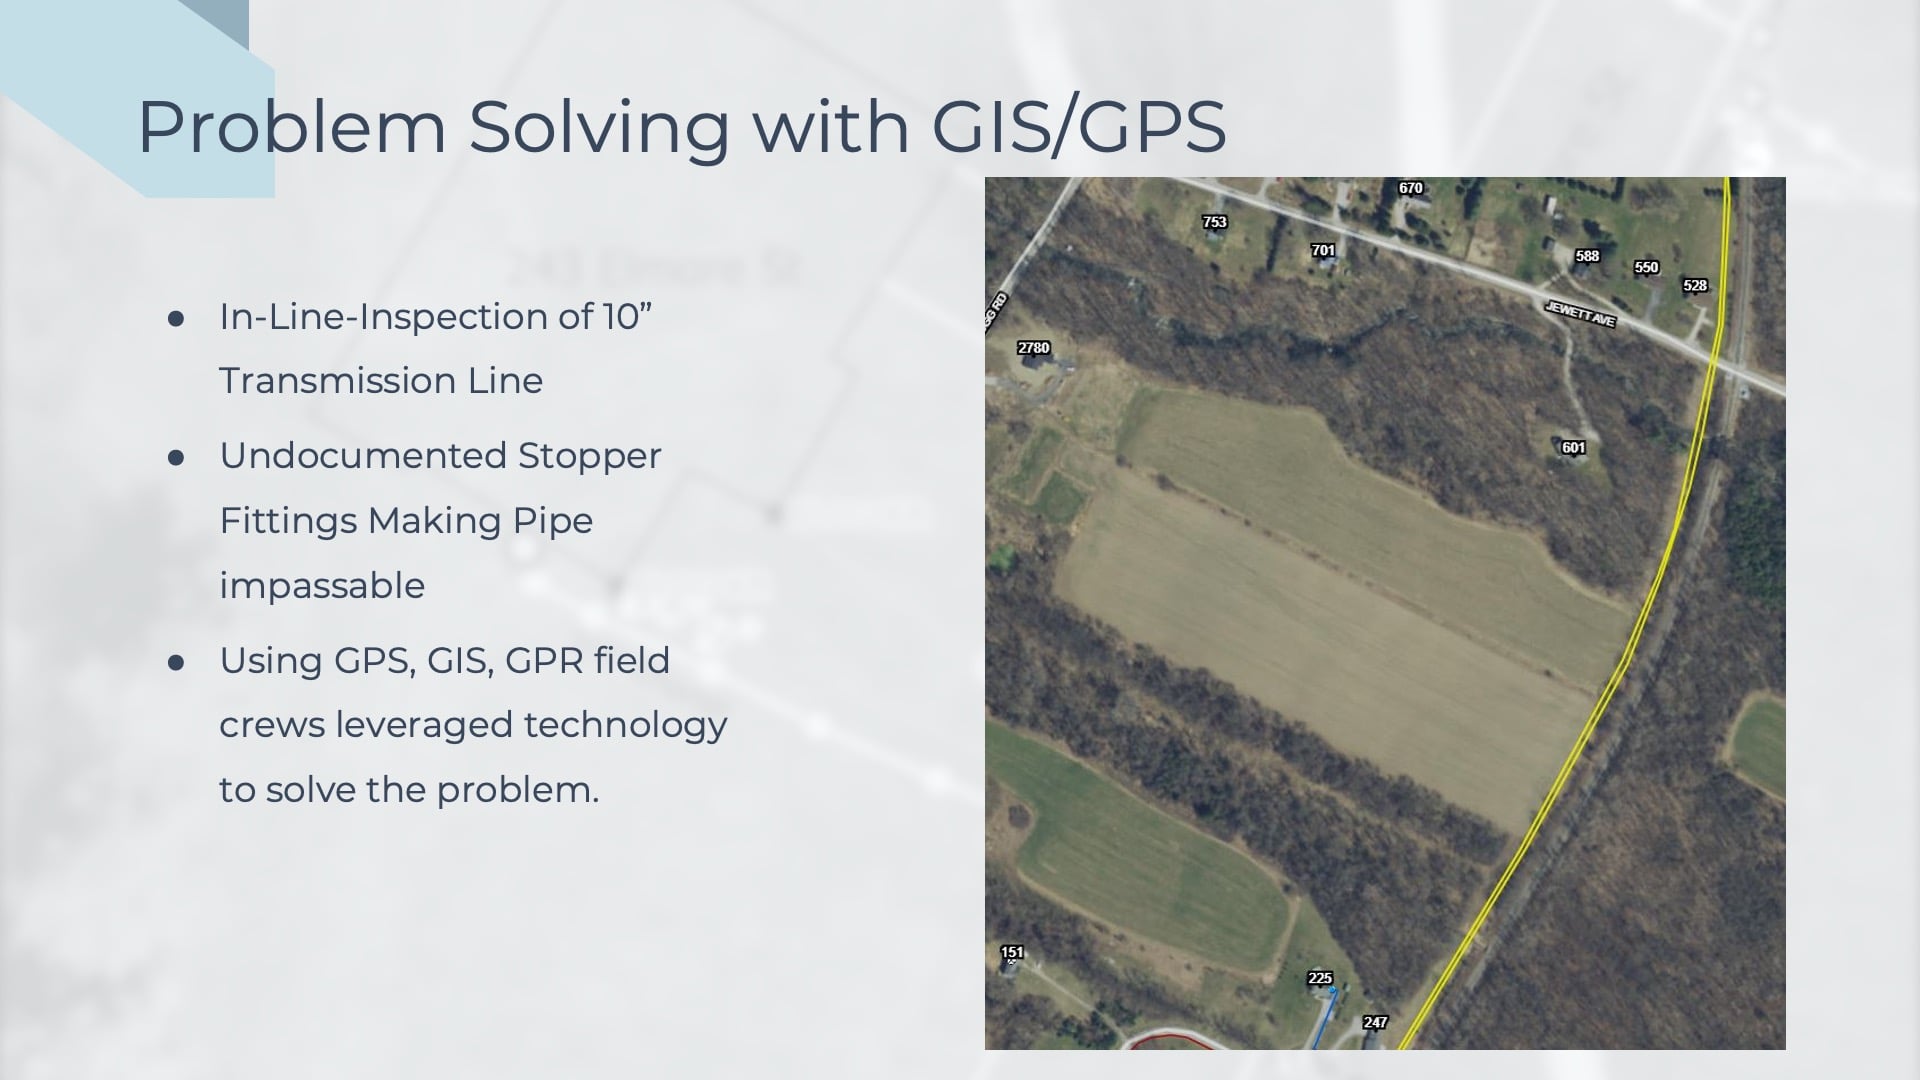
It was somewhere south of Jewett Ave., and we had a pretty good idea from talking to some retirees that it was installed in one of those two agricultural fields. That’s all the information we had. The ground-penetrating radar wasn’t giving us a lot of good results since all the test holes we’d dug turned out to be the wrong locations. Some of our staff asked how far our orthoimagery went, and we reached out to the state for that information. With the information, we got from the orthoimagery that summer, and we were able to trace where the stopper fittings were installed.
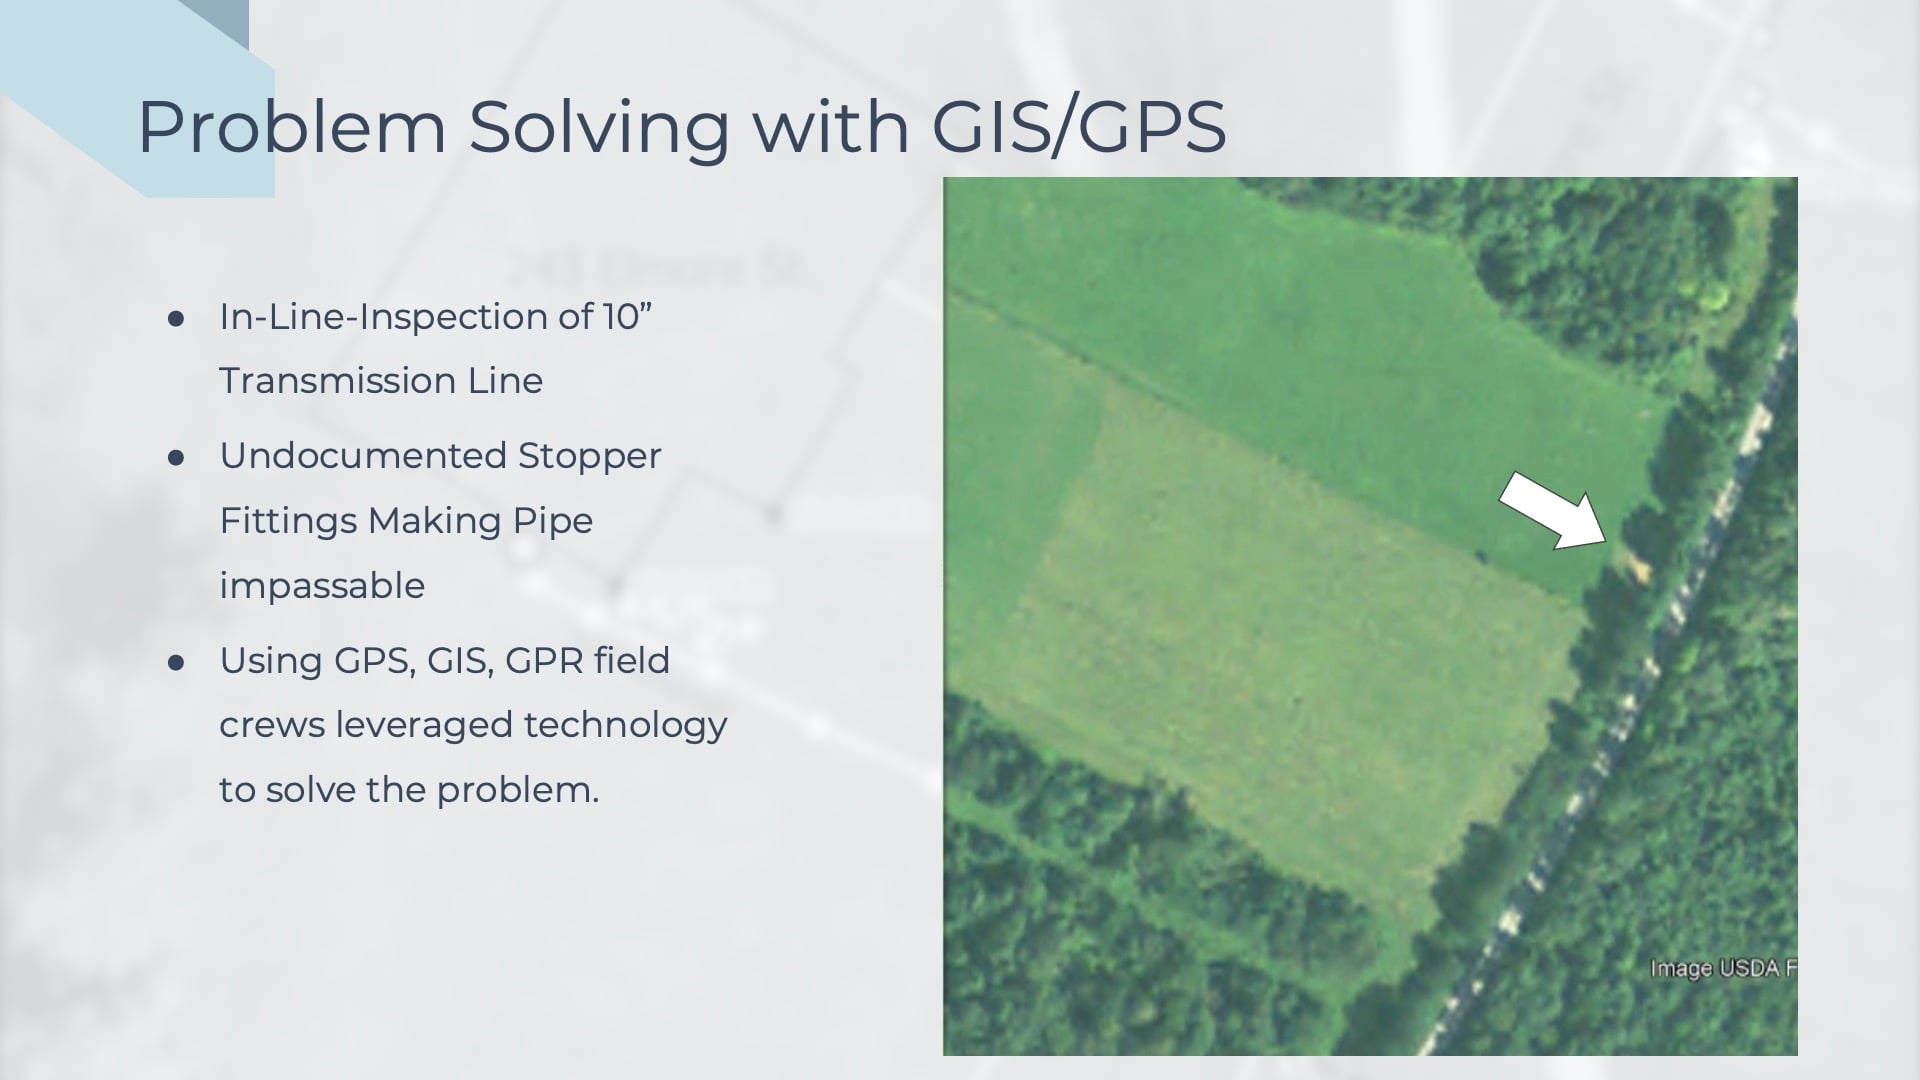
You can see that it is that location where the grass is a little discolored. We think that was probably the hay they put over to re-sod that field after they did an excavation. Using the GPS unit, we laid out a small grid in that area and began excavating, and sure enough, we found the stopper and actually found a small leak in that stopper as well. So that was another added benefit.
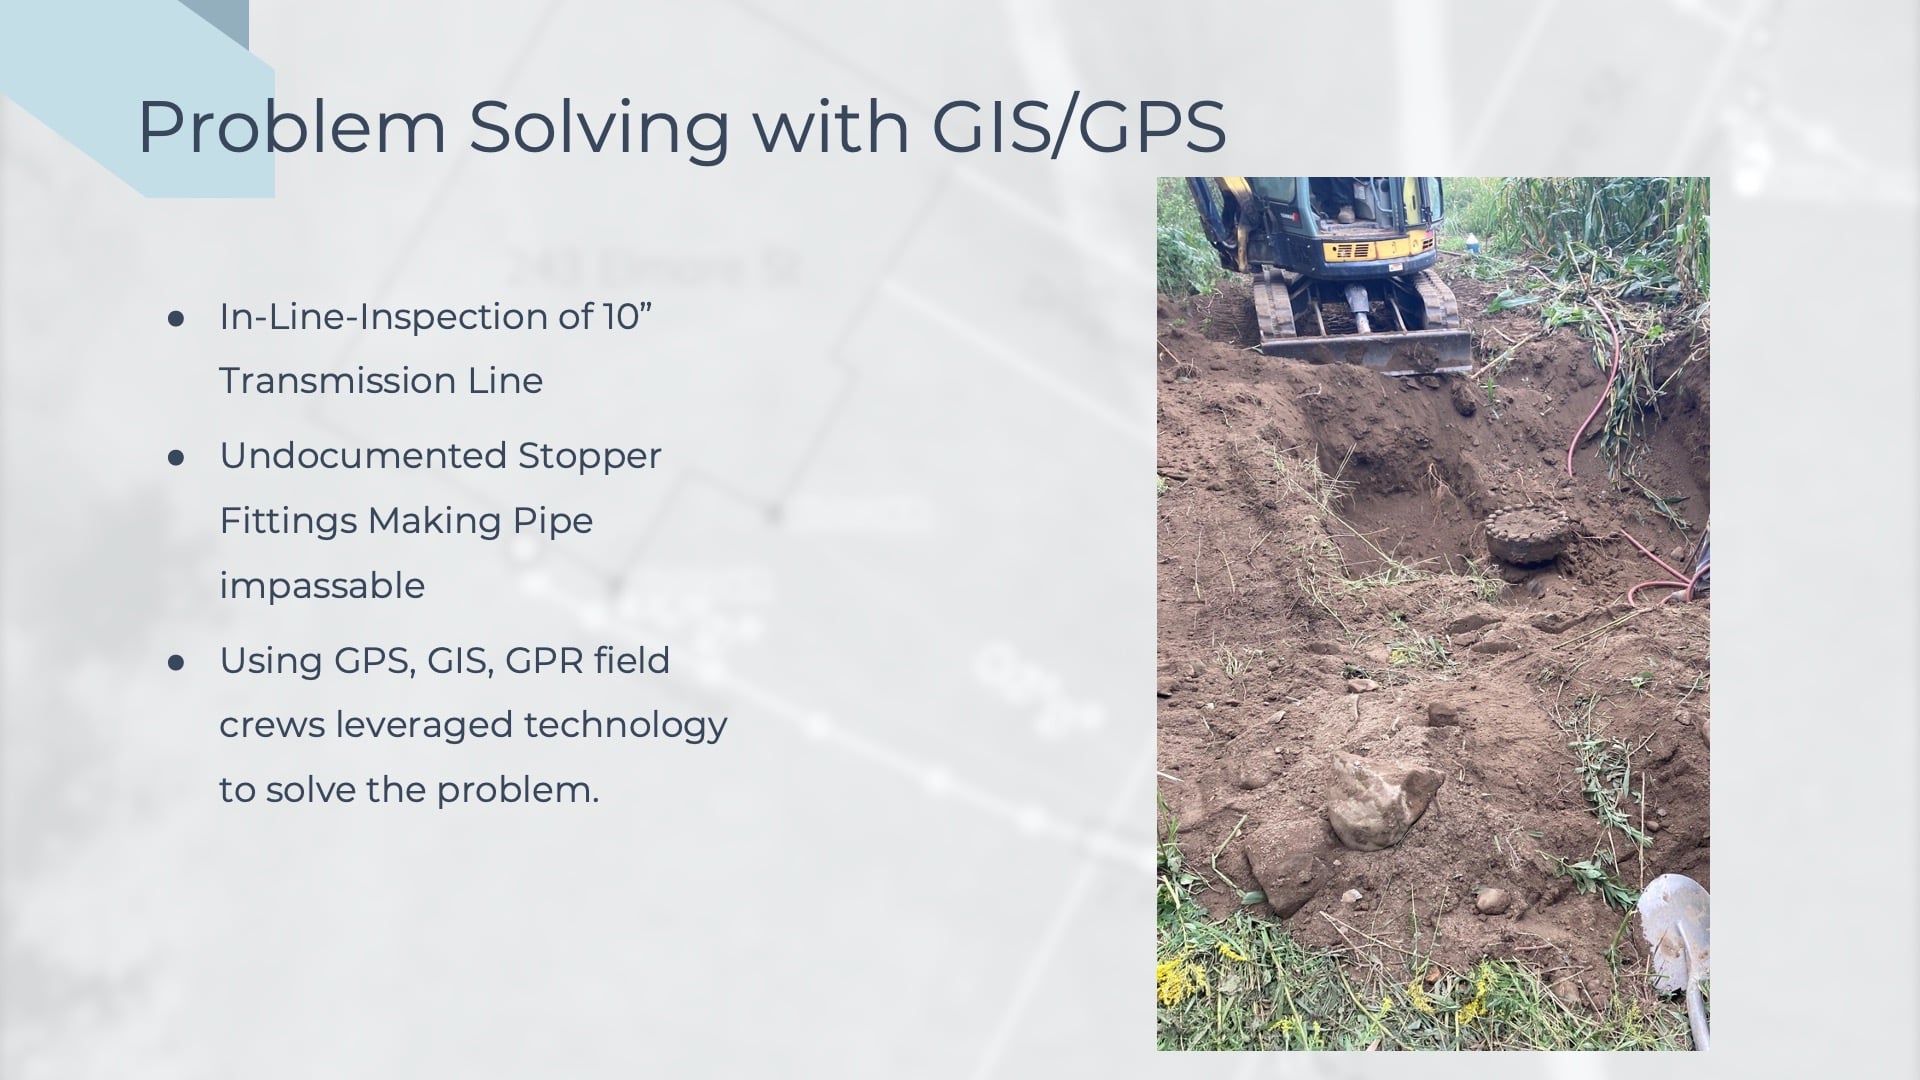
This happened without myself or other GIS staff getting involved until the later stages. Our field staff use this technology to solve problems without us — that was a great win for me as the leader of GIS in our department.
Looking Forward by Looking Backward: Rolling Out the New As-Builting Technology to Map the Existing System
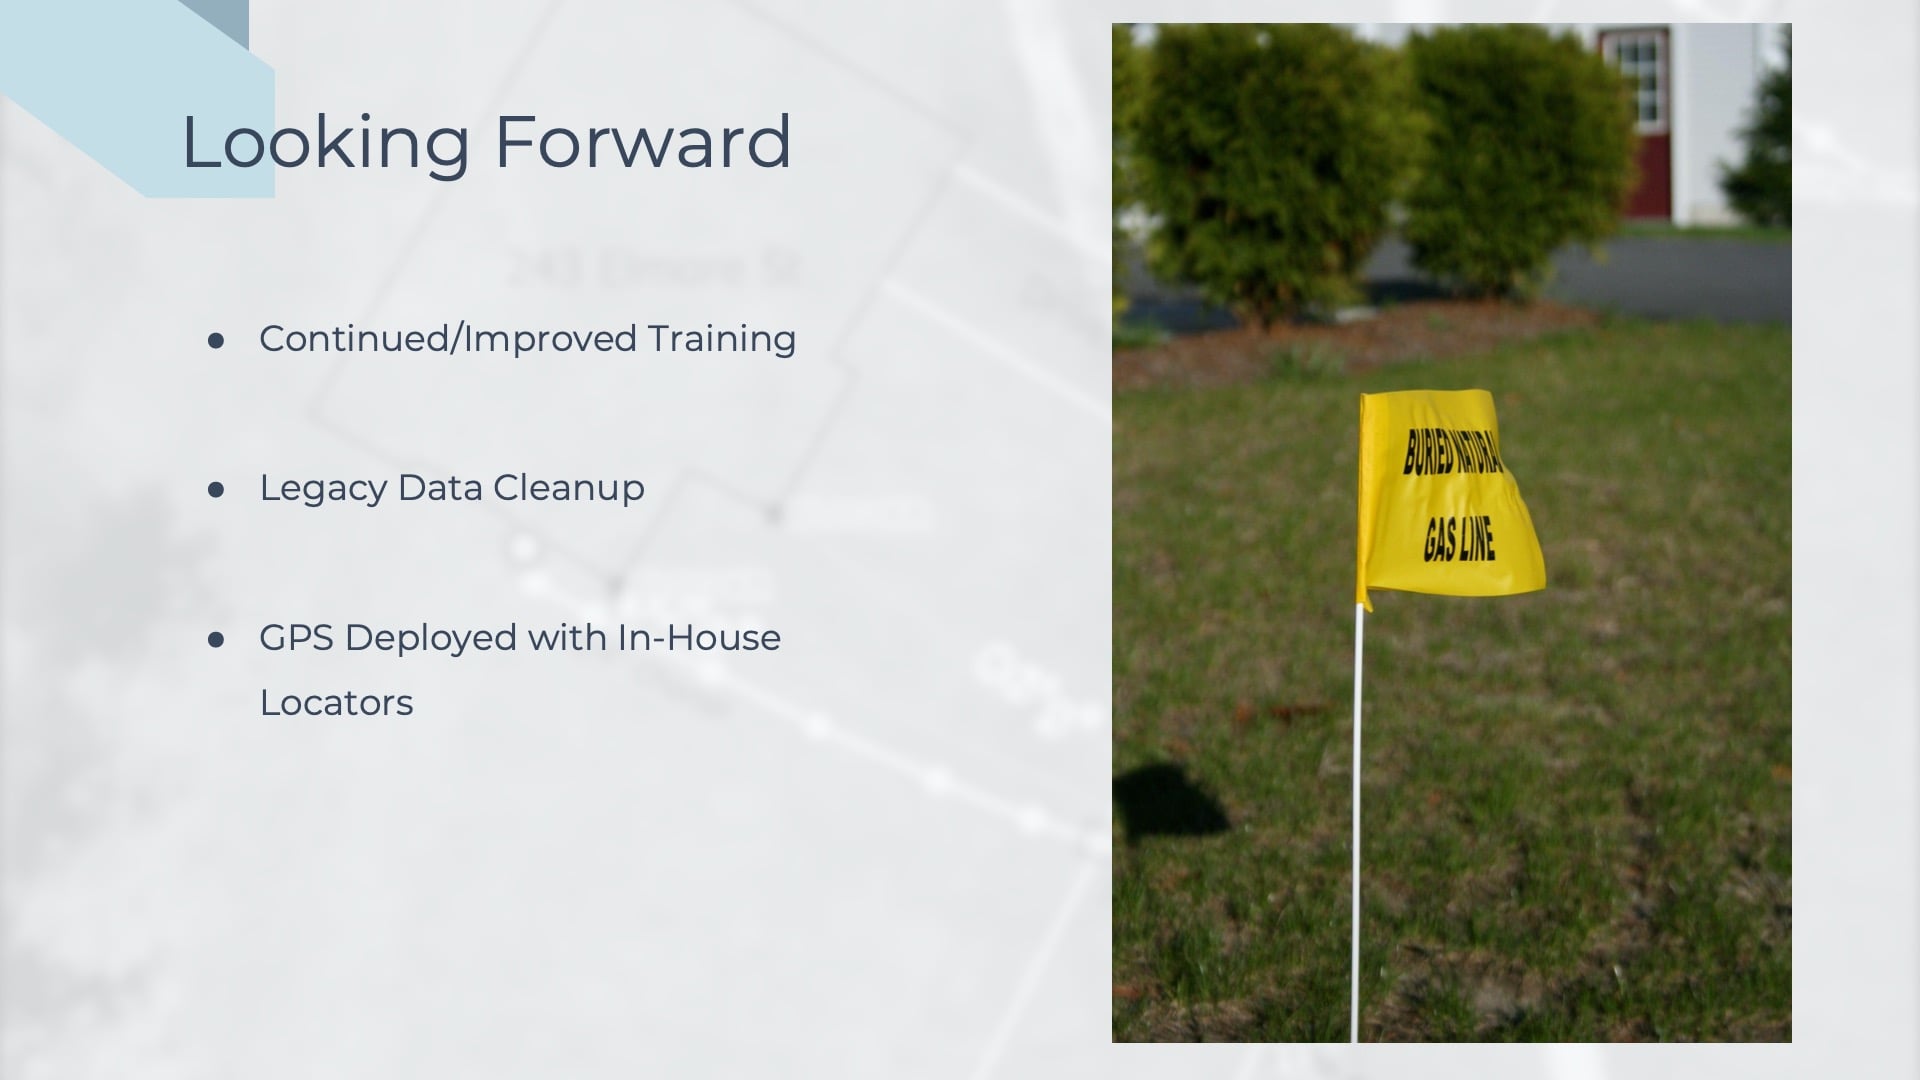
Even though we’ve put a lot of work into GPS-ing as much of our system as we can, we still have less than 10% of services and mains that have been GPS-ed with good, reliable data. That’s a blind spot and a risk to our system. So, the next iteration of this project is looking backwards. Now that we have new data collection handled, and we have really good confidence in our field folks and the contractors that we use, we’re going to get good data on that.
Now we can start looking backwards. We have a team of in-house locators that are true experts in finding gas pipes underground. The oldest, rustiest pipe without tracer-wire? Anything in the world, these guys can find. We are going to enable them to recapture GPS data as well. Every time they put paint on the ground, that’s an opportunity to collect really good data. And without a large GIS department, it’s really tough to collect that data.
So, the next iteration is putting some GPS technology in their hands to allow them to easily collect data without interrupting their work as much as possible. We want to continue training them, to continue building that GPS muscle. Training this staff will get us to wean ourselves off of paper and these are really the next big steps for us as a gas company. This will help us to keep pace with some of our peers in the utility space. From here, I’d like to turn it over to Jean-Yves with Eos Positioning Systems, who’s going to lead our next little conversation.
High-Accuracy GNSS in the Gas Industry
JEAN-YVES LAUTURE, EOS POSITIONING SYSTEMS: Thank you, everyone, for joining and listening to James’s presentation and Mathew’s presentation coming up. I can only smile about the evolution of all this. When I started doing GPS 30 years ago in 1992, at the time a pair of RTK receivers to do one centimeter accuracy was about $80,000 U.S. The things that are being done today are things we could only dream of back in the day. It is fascinating to see how everything has come together, from the computer technology growing from the old DOS [disk operating system] to the day-to-day where James and Mat can use standard iPhone®s, iPad®s, and Android phones to do their field work.
The internet has also evolved. In the early days of GPS, there was basically no internet until the early 1990s. It allows us to have all the data collected in the field live on the cloud. People can now see what you’re doing. Also, the price of GNSS receivers has come down. Technology has definitely evolved, and we’ll talk a little bit about this shortly. All of these inventions combined have given us the tools necessary to achieve excellent results in GPS.
Knowing your Locations is Everything: You Can’t Make Strong Decisions without Information
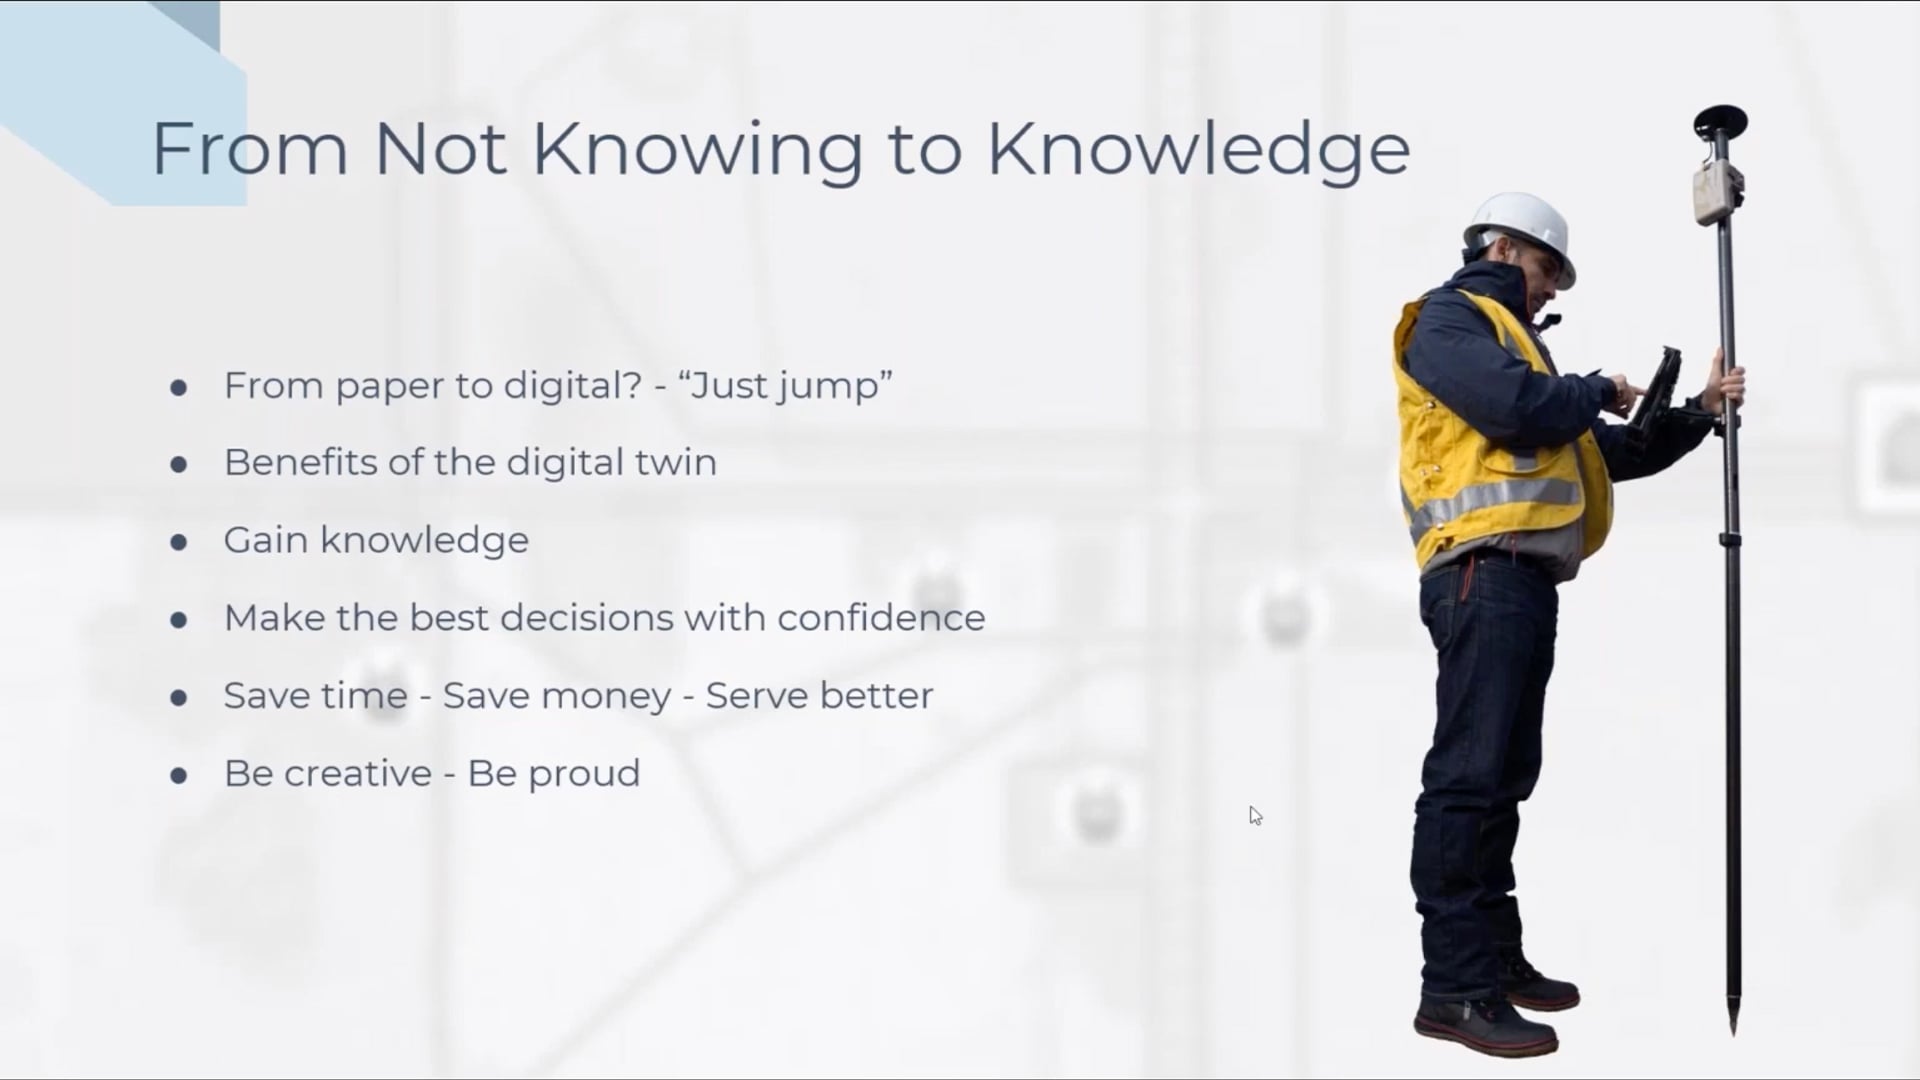
There’s a lot of value that comes from having knowledge of where your assets are. It can be done. Just jump!
One key thing I say, is that “Knowledge is all.” I can see, throughout the customers, a trend in wanting to know where their assets are. This started in the last decade when people noticed that the technology was available, the tools were available, and the software was available. Esri did a fantastic job with their applications; an example is ArcGIS Field Maps, (formerly ArcGIS Collector).
In order to give the best tools to the people and enable their data collection, we must bear in mind that what they need is knowledge. The fact is, if you don’t know what you have, you don’t know what you’re dealing with. And you’ll be completely paralyzed when something goes wrong if you don’t know where it was installed. Most times, utilities have to call retired staff, and often nobody knows where to find them to see if that pipe was between that street or that street. They may end up using paper maps or CAD drawings, and you have to reconcile all that and try to make a decision.
The benefits of getting all your assets right are immense. People say, “Will that be difficult?” No. Just jump! The benefits that you get is knowledge. You know where assets are, you know what they are, and then you can make better decisions. This information can also be shared, as James said. You can share your maps — zoom out and zoom in to the details and even have a global or very detailed view. With this, you save time, you save money, and you can serve your customers better. We can also see the creativity in James’ presentation, where the information can be used to solve other problems that may arise. Augmented reality (AR) can also be implemented, and people can interact with their data in 3D. So there’s a lot that comes from having knowledge of where your assets are. It can be done.
You can have one centimeter accuracy in your hand. Even people who don’t know much about GPS technology can easily be trained to get one centimeter of 3D data directly from the field to your map in the office. This is available to anyone and easy to learn.
The Evolution of GNSS: Instantly Available for GIS Users Today
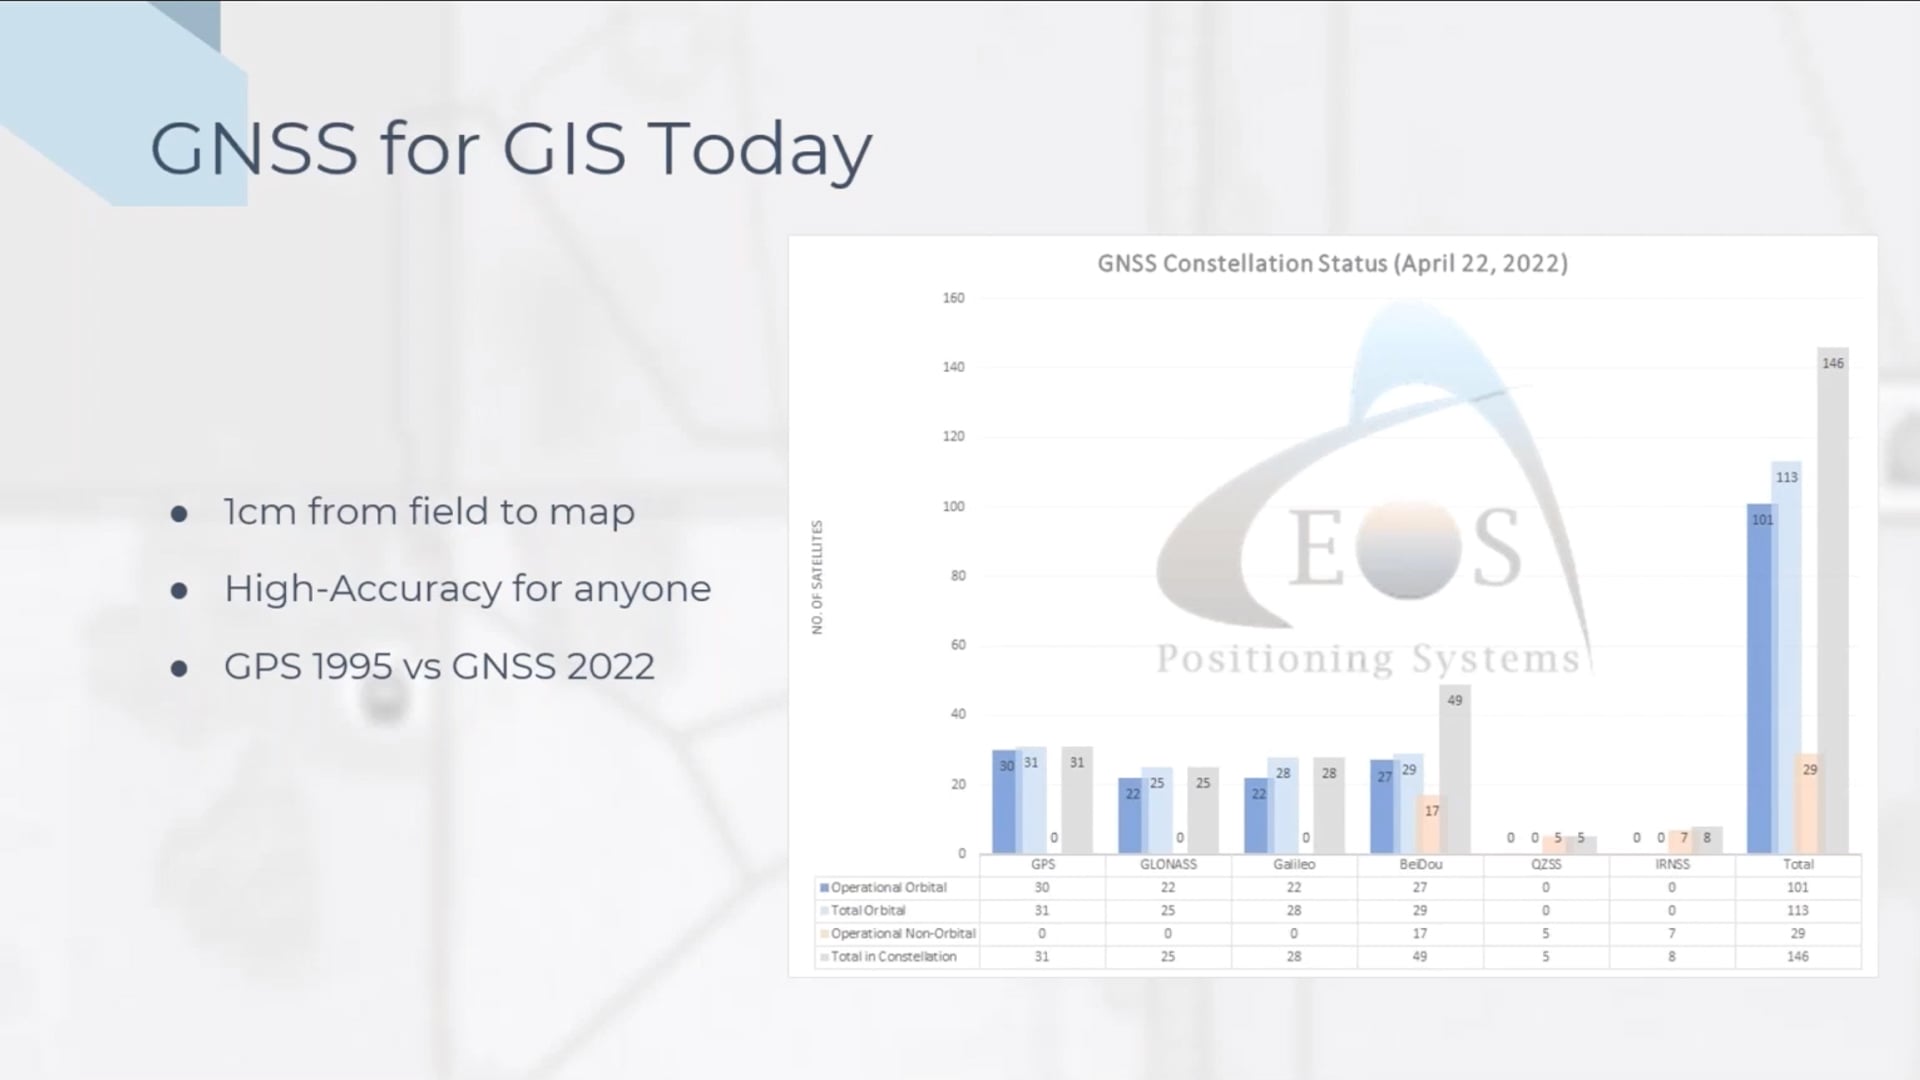
We have a quick chart here that details the GNSS constellation status. We publish this information every month in our newsletter. You can subscribe to our newsletter and get this at the end of the month.
When the U.S. Global Positioning System (GPS) was declared fully operational in 1995 with 21 satellites, that’s all we had. So sometimes we could experience downtime. But today productivity has greatly improved with 113 global satellites available from multiple constellations. GPS, along with other GNSS [global navigation satellite systems] constellations — such as GLONASS, Galileo, and BeiDou — combined to form GNSS. Now we have more satellites available and therefore more flexibility, so this increases your accuracy. It increases your productivity. This is what you have today.
I’ll pass it on to Mathew, who’s going to tell us his story with Apex Utilities.
Tracking and Traceability: Capturing As-Builts with GIS and GNSS
MATHEW DESBIENS, APEX UTILITIES: I’d like to start off by thanking you all for attending my virtual presentation here on “Tracking and Traceability: Capturing As-Builts with GIS and GNSS.”
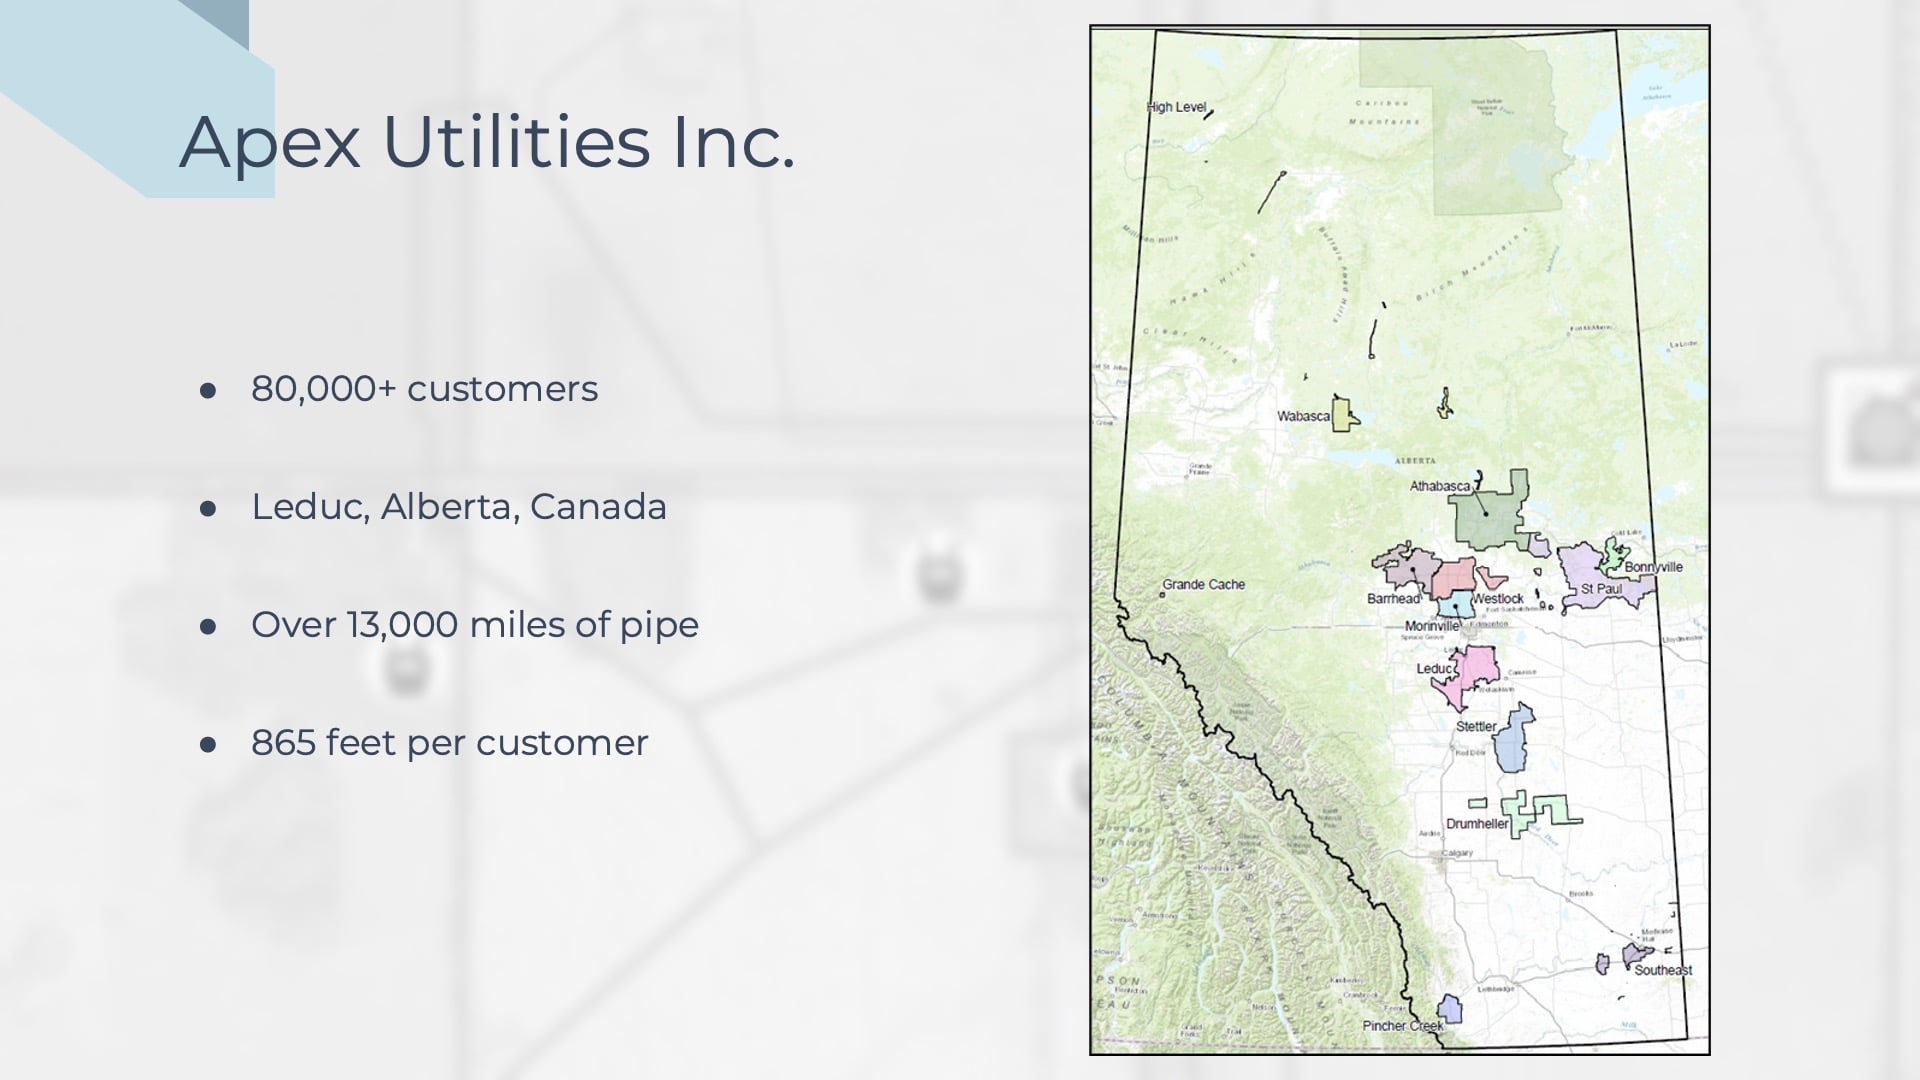
We have 13,000 miles of pipe in the ground, which is an extraordinary amount of assets. We’re very rural. What that means for the GIS group at Apex Utilities is that we have to do more with less.
Let’s start off with a review of Apex Utilities. Our service area is in the province of Alberta, Canada, which is a big province. To put it in perspective, the province is the same size as the state of Texas. As you can see on the map, our operating area stretches from the north high-level district, which is on the Northwest Territories border, down to Pincher Creek in the south, which is on the Montana border. We have a vast operating area.
Our head office is located in the city of Leduc, which is just a few minutes outside of Edmonton, Alberta, the most northern city with over a million people in North America. So, we have a unique operating environment here. It’s rather cold, and it’s quite rural. We have 80,000 customers, making us a smaller utility, but we do have 13,000 miles of pipe in the ground, which is an extraordinary amount of assets. There are many utilities serving well over a million customers with that much pipe. In our organization, our system has 865 feet per customer. We’re very rural. What that means for the GIS group at Apex Utilities is that we have to do more with less, and that’s what opens up our group to doing projects like the one we’re discussing today. We’re always trying to figure things out.
The Challenge: Replacing Legacy GPS Units to Meet Upcoming Industry Standards
We’ll start off with the challenge, setting the stage for this project. The primary challenge here was replacing our existing GPS units. Apex Utilities was an early adopter of digital as-builting. Back in 2014, we moved from paper as-builting to GPS as-builting. By 2017 or 2018, these units were four to five years old, and it was time to replace them. We were talking about 25 units at the time, so we decided to use that opportunity to check some boxes off on the new equipment we bought. The first checkbox was we needed to make sure that we got some hardware that was ASTM F2897 compliant. For those of you who aren’t familiar with what that is, it’s a standard published by ASTM F2897 International that defines how barcodes are printed, parsed, and interpreted by users for polyethylene pipe components for natural gas. All of the stuff we’re installing in our system has these barcodes, and we want to scan them while they’re being installed.
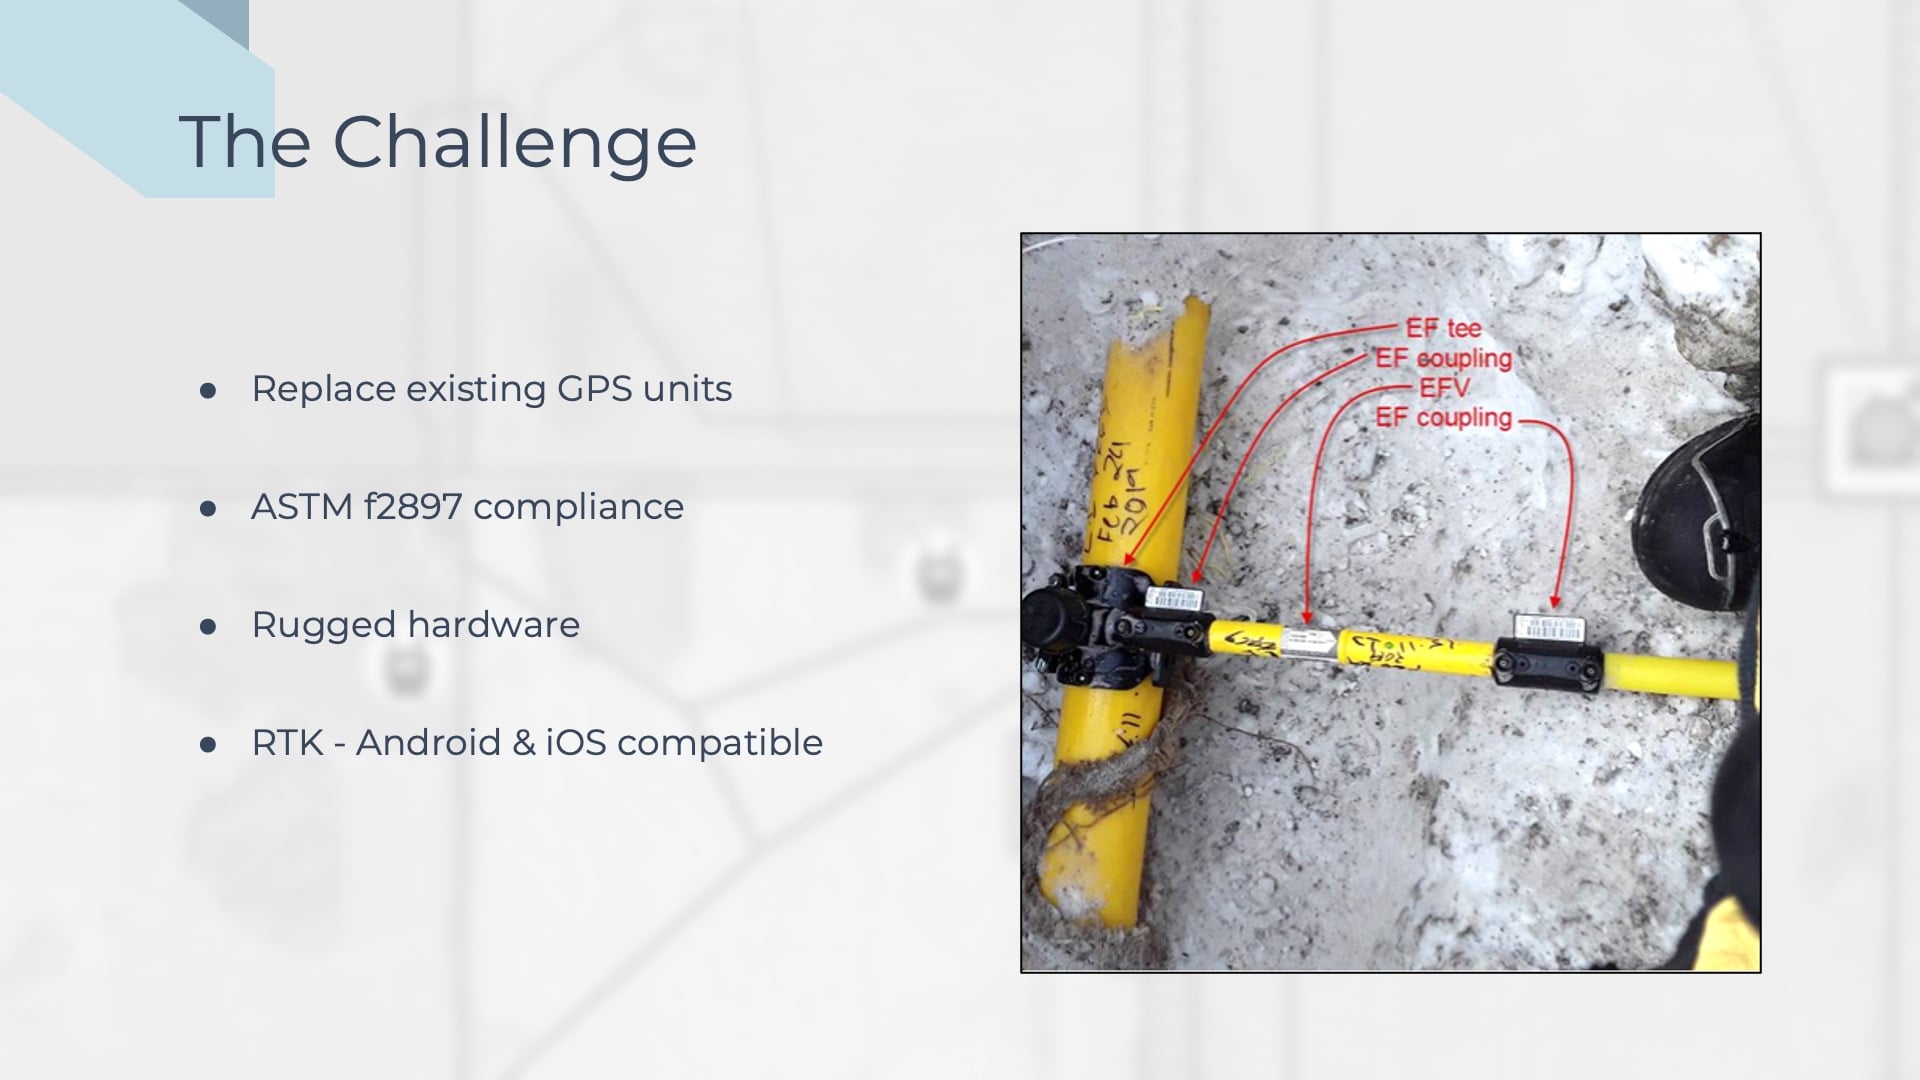
Another thing that was a challenge for us was that we needed some rugged hardware. On the last screen, I was explaining our operating area. We can’t just use any off-the-shelf GPS hardware; we have a really cold operating area. We needed something that would fit that.
In addition, our old system was using post-processing for accuracy, which we really wanted to get away from. So, we decided we decided to get hardware that was RTK, or real-time kinetic, capable.
Finally, we needed some hardware that would allow us to be Android and iOS compatible because we have a mixture of devices out in the field.
The Solution: High-Accuracy GNSS Receivers and ArcGIS Apps
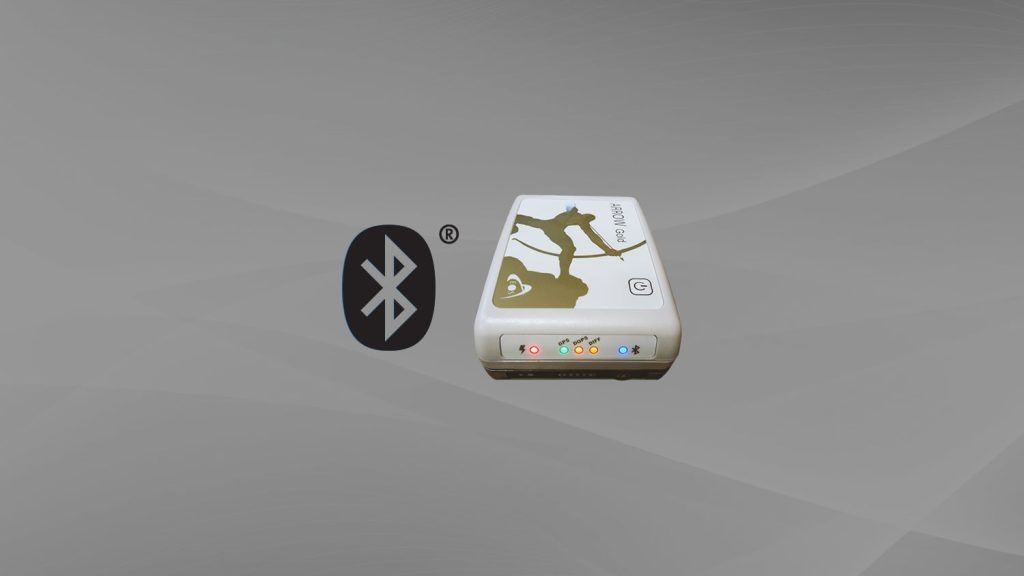
So, here’s the solution. In order to pick the GPS hardware, we mustered up some money and bought four different complete GPS setups from four different manufacturers. We then took that equipment out during wintertime for a few months, and we tried it in every weather condition and in every type of terrain in all different districts. After that, we got together and went through the results in the checklist. After looking at the results, the solution was easy for us to choose. We decided to go with the Eos Arrow Gold GNSS receiver. You can see it in the picture on the top. That GNSS receiver is Bluetooth connected to a Samsung Active3 tablet. Aside from a couple of small adapters, our GPS system is cordless. We are also using the Socket Mobile D750 barcode scanner, which has a very long battery life and is durable; this device is also Bluetooth connected to our tablet.
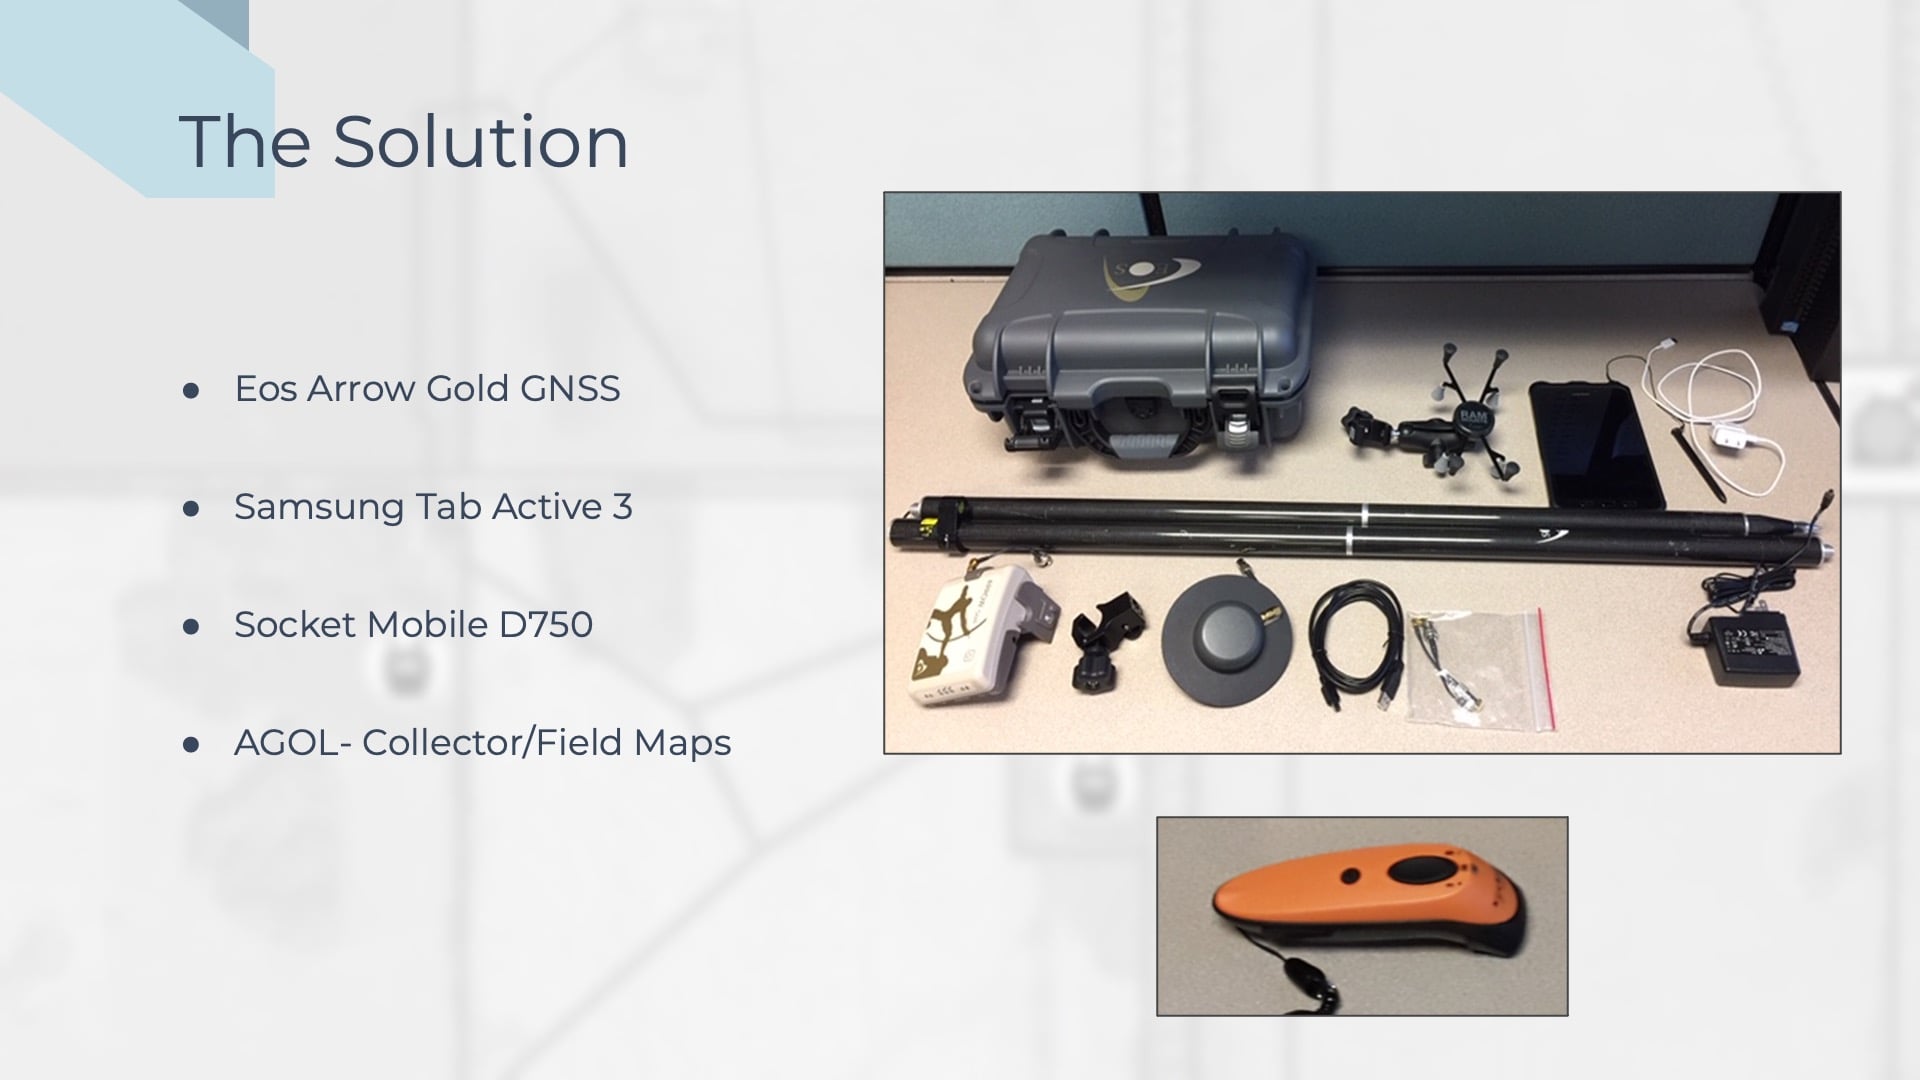
What we decided to go with for a software solution was – we were using ArcPad on our old devices, and we decided we wanted to update to Esri’s ArcGIS Collector, which turned out to be an excellent choice. (Editor’s note: Esri has since retired the ArcGIS Collector app and replaced it with ArcGIS Field Maps; Apex Utilities has migrated to ArcGIS Field Maps.)
The final solution was to use ArcGIS Online cloud as the data storage location for all data that was being collected in the field. What that means is that we host data to the users on the GPS devices by replicating our enterprise database to the cloud, which is then consumed by the users. So, they can see the data on their devices as they’re collecting it, and in addition, the data being collected by those users is stored and written to the ArcGIS Online cloud. We used this solution because 30% or more of our GPS users are contractors, contract inspectors, and construction contractors. And we need to allow them to as-built and collect data for us outside of our company Apex network. The ArcGIS Online cloud allows us to do that.
The Solution: The ArcGIS Utility Network
So that was a review of the solution from a hardware and software side. The rest of the solution involves the Esri ArcGIS Utility Network. We went down a rabbit hole because when we began this project, we were using an enterprise system using the geometric network. This system used the APDM (the ArcGIS Pipeline Data Model). However, once we started to get into this project, we realized that if we wanted to utilize those barcodes properly, we were going to have to change the schema of our system entirely, and that would mean moving from APDM to UPDM (the Utility Pipeline Data Model.) This made it seamless to work with the barcodes. After looking at that, we realized that the Esri Utility Network was released right about the time we were starting this project; this was around 2018 or 2017. After seeing that the Esri Utility Network did conform to the UPDM pipeline data model schema, we saw it as an opportunity to upgrade to the Esri Utility Network. The whole reason we did that was to accommodate this project, and it was a big undertaking. It would take a whole presentation to discuss that migration.
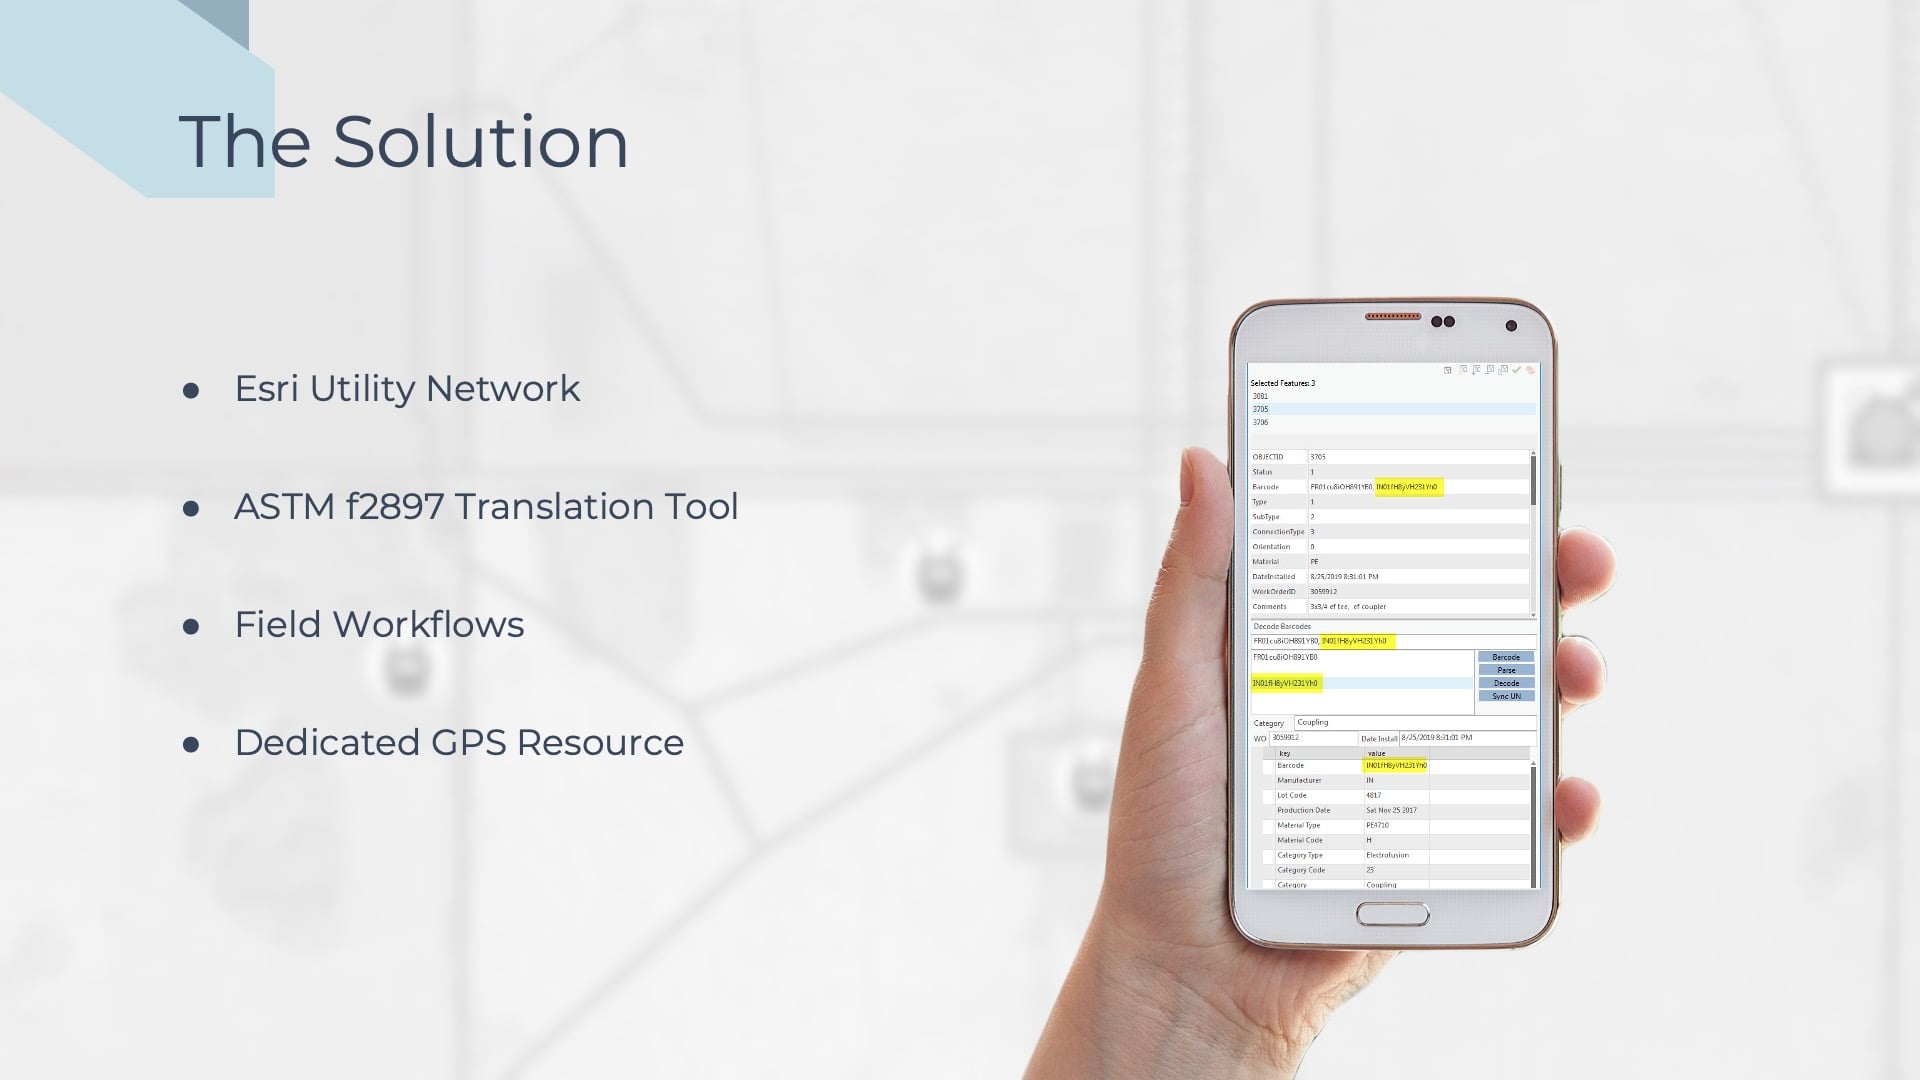
The next part of the solution is that our GIS team built a custom ArcGIS F2897 translation tool which we use in the ArcGIS Pro application. So, our GIS editing team in the office uses this application to translate and decode the barcodes we receive from the field, and the application also syncs the barcode data once it’s decoded to our utility network. What that really means is, it takes the information from that barcode and parses it out into the way we want to see it. It puts it in the format we want to see it, and then it syncs it into our enterprise system, into the fields we want that information to go to. It’s a fantastic tool; it does the editor’s work.
The other part of the solution, which can’t be understated, is field workflows. It sounds really simple, but it’s not. We could build the best GPS data collection system with the best hardware, but it doesn’t really mean anything unless we have buy-in from field crews, and we have defined workflows to follow and enforce. Truth be told, it took about two construction seasons (two years) to effectively develop and define these workflows and enforce them, but we’re there now. Currently, we’re updating our SOPR (standard operating procedure) to include all the new workflows for this barcoding.
The last part of the solution was the creation of a dedicated GPS resource. We have a GPS specialist within our GIS group, and that individual spends construction season supporting all the now 34 GPS units we have out there in the field for internal workers and contract workers. It is a full-time job, and we had to dedicate a resource to it. I’m sure glad we did that.
Benefits Gained: As-Builting Data Takes Half the Time Thanks to RTK Accuracy
After introducing this hardware and the barcode workflows, it decreased the time it takes for an inspector to as-built our data before a backfill by half, which is absolutely amazing.
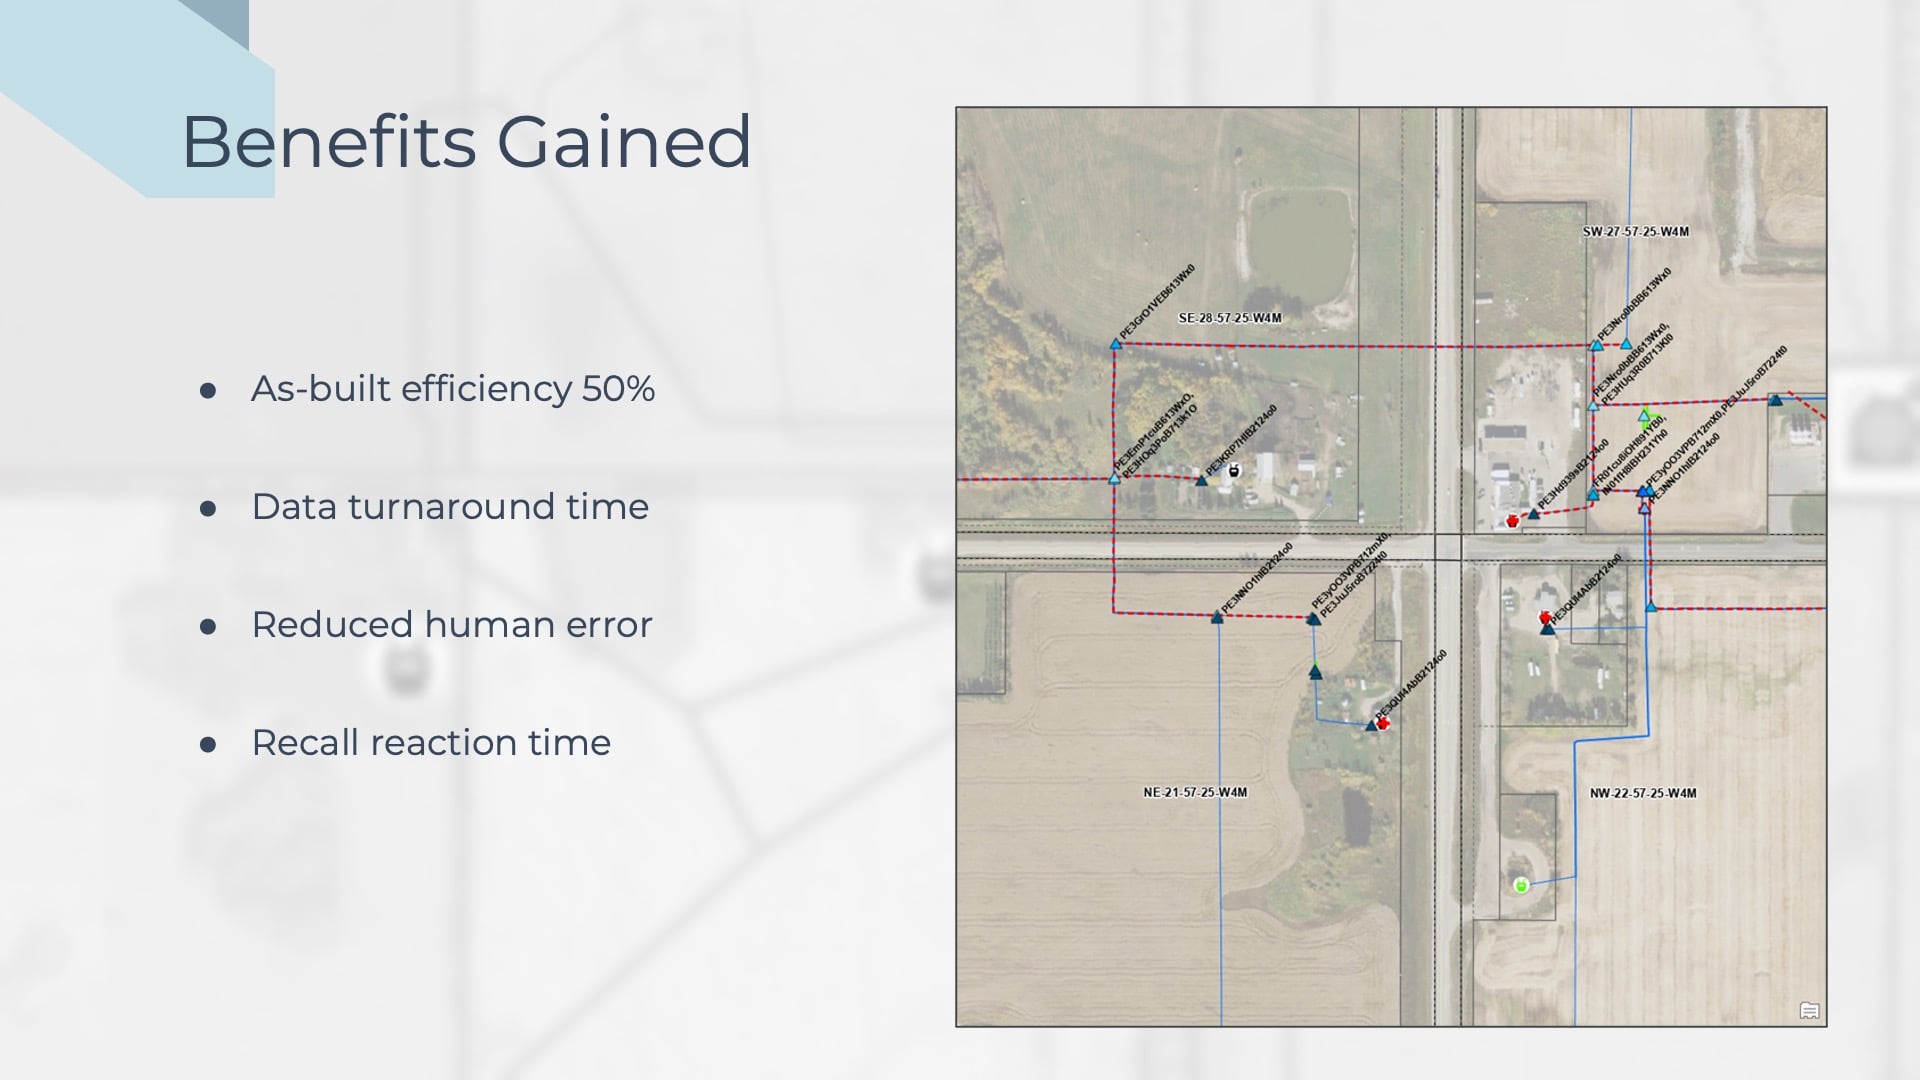
All right, let’s move on to the fun slide. What benefits did we gain from this project? The best benefit by far is as-builting efficiency; efficiency increased by 50%. So, after introducing this hardware and the barcode workflows, it decreased the time it takes for an inspector to as-built our data before a backfill by half, which is absolutely amazing. The reason for that is the new hardware with RTK accuracy. We sit there, we determine the spatial location, and click save. Then we take out the barcode scanner, scan the barcode, click save, and walk on to the next one.
Turnaround Time is Instant
Another benefit gained was data turnaround time. This is a big one as well. For example, in the past, it involved someone drawing a hand map of the data like James was showing in his presentation. It was done by usually putting it in the mail and getting it to the head office, who would then need to get it to the right department, etc. Currently, our data turnaround time with the new system is zero. Last summer we actually did the litmus test, where we sat in the office and ArcGIS Pro watching the ArcGIS Online cloud data while we had a user in the field collecting data. And we could see that user collecting data in ArcGIS Pro while we were watching it. Zero data turnaround.
Reduced Human Error
Another benefit is reduced human error; that one is rather self-explanatory. With our old system, we were using the ArcPad application. With this application, the user had to choose a diameter for the asset they were collecting; they had to go through a drop-down domain list of 20-something different diameters. Now, we just scan the barcode and click save, and that diameter is saved. There’s no slips of the pens, there’s no typos. It’s reduced human error.
Faster Response to Manufacturer Recalls — without Spending Hundreds of Thousands of Dollars to Physically Locate Affected Assets
The final benefit is recall-reaction time. This is a really big benefit for a regulated gas utility. For those who might not know, a recall is when we install pipes and components in the ground, and then after we backfill it, there’s potential for the manufacturer to come back to us and say, “Those components we sold you, they were defective, and they need to come out of the ground.” Or it’s going to affect our pipe system.
With this GPS system, we know precisely where this stuff was installed and its attributes, including the manufacturer’s lot number. All this information is stored in the barcode. So, if there’s ever a recall now, we know exactly where the assets are and what they are. There’s no spending money hydro-jacking, daylighting holes all over the place, or spending hundreds of thousands of dollars. It’s a huge benefit to the organization as a whole.
Apex Looks to the Future with Arrow GNSS Base Stations and More
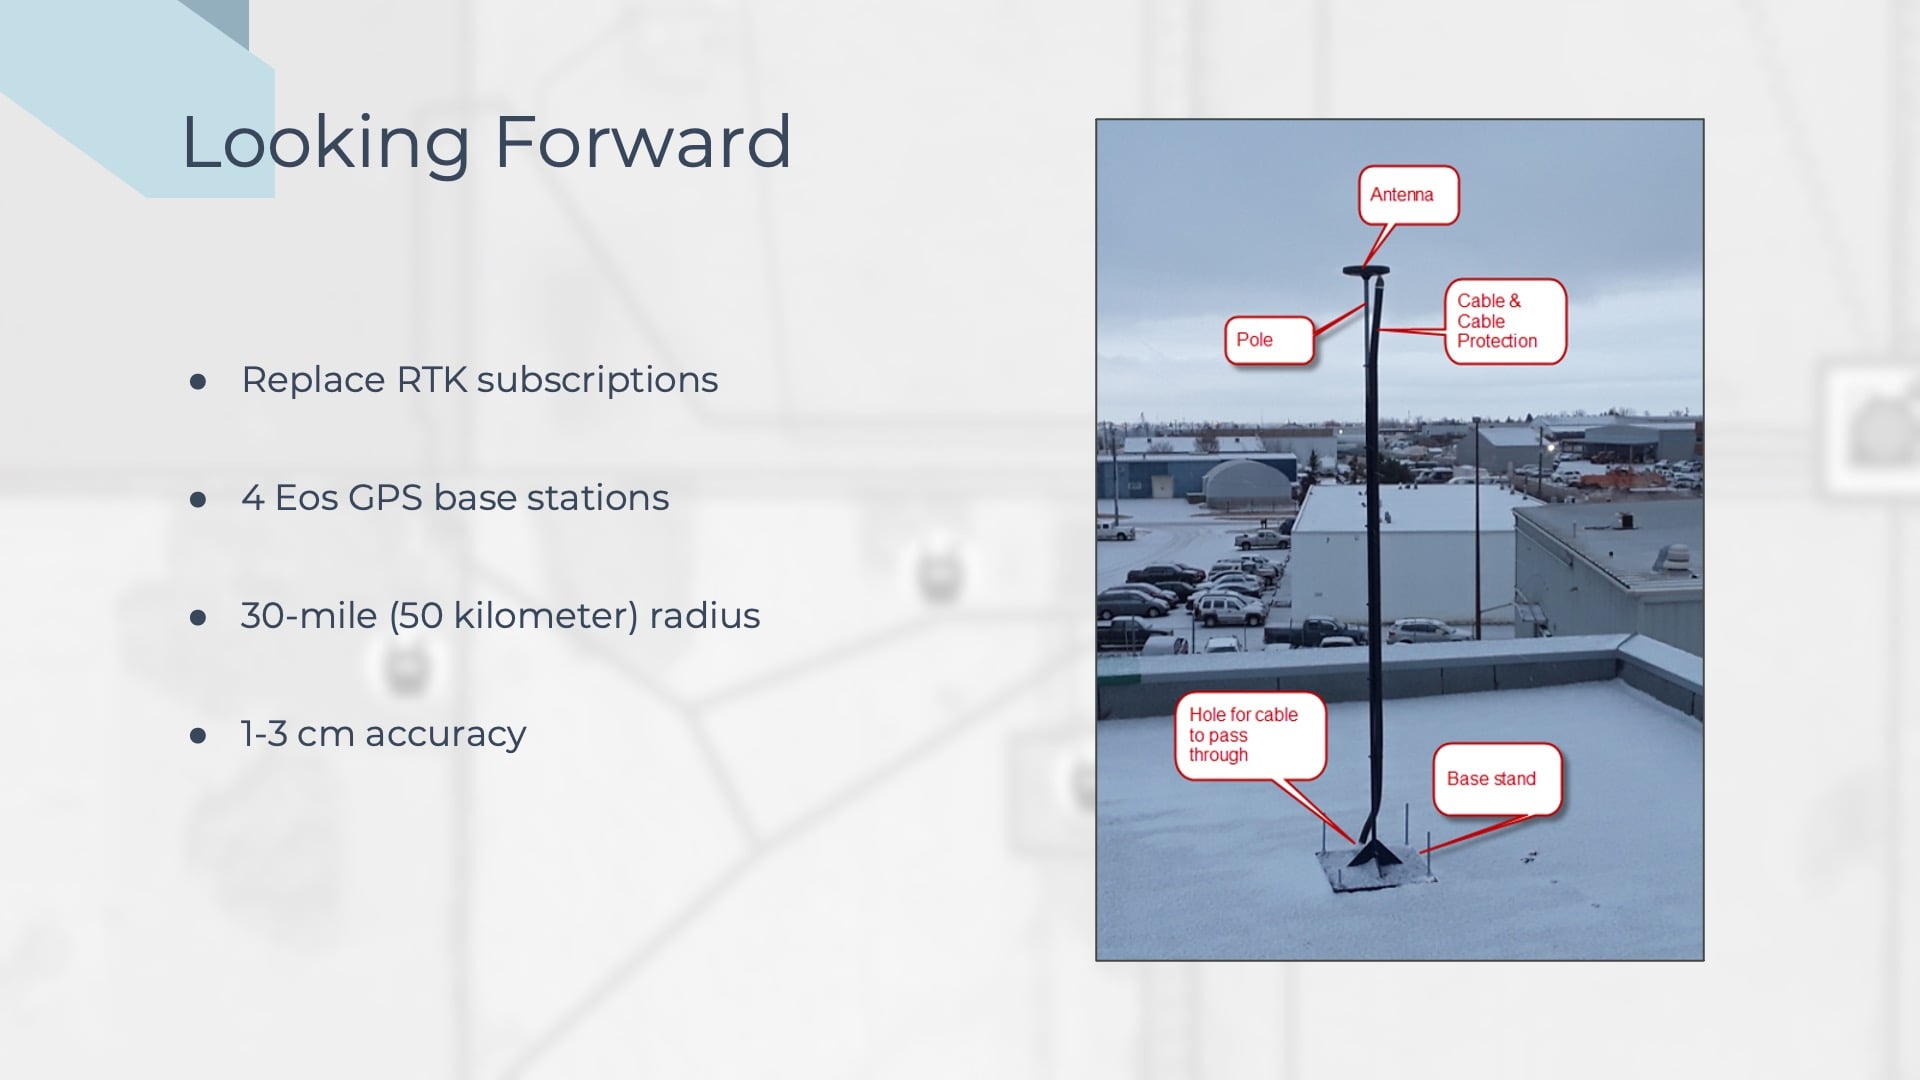
A very quick look at our final slide. We completed the project we just reviewed. The first season was 2020, which means we’ve done two full construction seasons with that now and we’re about to enter the third. Our GIS group at Apex Utilities get bored very easily. After that project, the question was, “Alright, what are we doing next?” The answer to that is, we want to replace our RTK subscriptions. In Alberta, to get RTK accuracy, we had to subscribe to an RTK tower network that covers our operating area. Ultimately, we want to get away from that due to the high cost of annual subscriptions we have to pay for operating and maintenance funds.
The solution to that was to install some Eos Arrow Gold base stations. A year and a half ago, we bought an Eos base station, and we set it up in our biggest district office. You can see it in the picture there. Last construction season, we used it, and it offers RTK accuracy to everyone in that operating area. That GPS base station has a radius of 30 miles, or 50 kilometers, which is huge. We can have as many users use it at one time as we want. We’re getting one to three-centimeter accuracy, which is absolutely great. Even five years ago, if you told me that mapping-grade GPS hardware Arrow Gold was going to get us one centimeter accuracy, I wouldn’t have believed you. Because at the time, you would’ve had to get a survey-grade total station hardware to do that. But times have changed! I’m really glad to be getting that accuracy.
That does conclude my presentation. So at this time, I’d like to hand things over to Sarah at Eos, who is going to guide us through the Q&A period.
Audience Q&A
SARAH ALBAN, EOS POSITIONING SYSTEMS: Great, thank you so much, Mat. Thank you so much for those presentations; they were fantastic. We did get a lot of questions coming in, so we will get to as many of these as we can.
QUESTION 1: What are the safety considerations for using digital map data on an electric device when responding to leak events?
JAMES: So oftentimes, as our folks are responding to leaks in the field, they’re often not going to have a GPS unit. Or if they are, they’re not going to be using it, they’re just going to be trying to find that leak. But giving them that tool is helpful.
We actually had a situation about a year-and-a-half ago where there was a leak happening on a stub service for a building that was completely demolished by a fire, and its foundation was gone. So the thing they took swing ties off of was gone. We were fortunate that the folks who did that retirement took a GPS shot on the stub. So, they were able to get that stub GPS-ed, and they were also able to lay out the old building footprint because they’d taken some points there as well to get those ties points to recreate that situation so they could:
a) Find exactly where that stub was and
b) Find the rest of the contours of that line that was retired
It helped them recreate that, so that was one situation. But oftentimes they’re going to be using that tape and snapping lines from things that are static in the environment and using a tape measurer to get back to that. So having that technology available on their phone also is super efficient and saves us from the stress of so much paperwork. It’s a tool in their toolbox, but it’s not the silver bullet.
QUESTION 2: Is there usually a delay in releasing new hardware connectivity to iOS if you provided the Android version first?
JAMES: I’m probably not equipped to answer because we’ve only ever existed in the iOS environment. We haven’t used any Android.
SARAH: Jean-Yves, maybe you want to tackle that one. You could speak about launching iOS devices with GNSS first and then switching to Android, and then Tom, perhaps you could talk from the GIS perspective using Field Maps on either device.
JEAN-YVES: We can see some differences in the market because people make choices based on their preference, because all the apps and the hardware work the same way, with minor differences — whether you use iOS, Android, or even a Windows tablet. A lot of people use iOS because they feel it’s safer, more secure, and sometimes easier to handle because when Apple® releases an update, it goes across all their devices. Whereas with Android, you have to deal with the Android 4, 5, 7, 8, 10 … etc. Each manufacturer has its own “flavor” of Android, and it makes our tasks as developers much more difficult. Due to this, we have to say that below a certain model of Android devices, Eos Tools Pro can no longer support the hardware. So we have to make that decision at some point, because the differences are too big.
But I would say it’s a matter of preference. In the true sense, it doesn’t really matter; for example, if your iPad® is broken and you have an Android cell phone, you can take it out, download your Esri apps, whether it’s Field Maps or ArcGIS Survey123, and keep on working. There’s no more excuses. I remember back in the old days when workers would have their tablet broken, they’d say, “Well we can’t work today.” There’s no more excuse for not working.
TOM: Jean-Yves captured it well from a technology point of view. When those things roll out as part of the system, there isn’t a lag. It’s a question really for our [technology] partners in terms of exactly how they take that and get it to market as soon as they can.
QUESTION 3: Are there any timeline mandates that you’re aware of that have been handed down to the individual gas companies stating that, by a certain time, they will all be required to use digital GPS plotting or tracking for their systems?
TOM: Certainly not on a national or a global scale that I’m familiar with.
But if you think about it, just in the U.S., the industry is over a couple of hundred years old. For some years, they were literally no maps. In the very early days, the maps was in the head of the person who put the pipes in the ground. After that, we moved to paper maps. We need to remember that the industry started out as a manufactured gas commodity. At one point, there were tens of thousands of these on a city level. It was even known as city gas in many cases, but those eventually rolled up into, today in the U.S., only 57 corporate gas families that have a hundred thousand or more services.
All kinds of maps exist, and they’re in different formats on paper. So, the answer is no. I think the industry has done a great job of progressively moving those old maps to more modern forms. As James and Mathew have testified, we’re on the home stretch of hopefully creating new data that is incredibly accurate. And moving the old data to this is an incremental kind of move in most cases, and it occurs as utilities find the necessity or opportunity to do so. But there’s no standard that I’m aware of in the U.S or elsewhere.
QUESTION 4: Is there an approval process from the field before it’s entered into production? (Before your GIS data from the field is entered into your production GIS?)
JAMES: Yeah, the approval process for Vermont Gas is handled by myself and my other colleague in our GIS department. We move everything from that cloud environment, make sure the accuracy is good, and we put a couple of finishing touches on it and then send it into our production database. It’s relatively informal, but we have eyes on it, and if there are questions, we go back to the field. Mat, I’m not sure if you have something a little more refined than us.
MATHEW: We use a very similar process. We look at the GPS points that are translated by the barcode, and our GIS drafters or editors in the office ensure that it’s good before they push it into a session in production. It is a manual quality control process that is necessary.
QUESTION 4b: There’s a follow-up to this question: Are you still producing an electronic as-built?
JAMES: We have GIS as our digital twin, and that’s how we report it in our system of record. We also have a bunch of old paper files, and we still have CAD files that we update. We’re now supplementing a lot of the old paper files with really detailed GIS maps. So, we’re not going to be creating any more paper maps or updating existing paper maps. Instead, we will be converting them to these really detailed GIS maps. But yeah, there are still a lot of copies and a lot of redundancy. We’re getting there.
QUESTION 5: Mathew, what specific issue did the Arrow Gold solve, or what did it do better than the other GPS units you tested? Was it just the performance in your cold operating area?
MATHEW: So, the cold performance, like you mentioned, was the primary reason why we went for the Arrow Gold. It was the most rugged among all the GPS units we tested. The feedback we got from the users on the field is that it was the easiest hardware to set up and get going quickly in the field. Additionally, accuracy-wise, we tested four different units under SBAS [Satellite-based Augmentation System] and GNSS (using the same satellite connectivity), and our accuracy turned out to be the best while using the Arrow Gold hardware.
QUESTION 6: Mathew, how are you handling steel and other non-barcoded items in your data collection process? Do the field folks have to choose from a drop-down list or something else?
MATHEW: That’s a really good question. The ASTM F2897 barcoding applies to polyethylene assets purely. Now the other material we install as mentioned there is steel for road crossings and high-pressure pipes.
The answer is yes. We default back to a process of using domain drop downs in ArcGIS Field Maps, or Collector, when we collect that information. It’s far and few between, but I’m hoping that in the future, there will be another standard for barcodes that would cover steel. It would be very beneficial to us and the industry as a whole. However, until then, it’s the manual process.
QUESTION 7: What’s the initial and ongoing annual cost for creating your own RTK base station or RTK network?
JEAN-YVES: Well, it depends on a lot of factors. You have to evaluate how many people you have working in what area and if it is worth it to get your own RTK base station.
This is because a lot of states in the U.S. have free RTK networks from the various state departments of transportation. States such as Florida and New York have these installed. So, in those locations, even if you have 200 units in the field, it’s not an issue. It’s free. All you have to do is connect to it and get your RTK data.
Now, the issue is when you are in a state where you don’t have that. The paid subscription cost per receiver can be anywhere from $500 to $1000 (USD). If you have, say, more than 10 receivers, it’s worth considering having your own base station because it will be paid within a year. However, when you have a single base station compared to an RTK network, you’re limited to the distance from your base station; this is called the baseline length. The baseline length is usually one centimeter in accuracy per 10-kilometer baseline length, so if you’re at 50 kilometers, your accuracy will be anywhere from three to five centimeters, which is one to two inches of accuracy.
Another thing that helps is when you have a multi-constellation setup and a lot of frequencies to work with. If you have, say, triple frequencies, you have more signals to play with and you can go further from your base station. Some have what they call long-range RTK, and I’ve seen some people go about 120 kilometers with a single base station. Although your accuracy goes down to about eight to 10 centimeters, you’ll still have good data.
So, there’s a lot of evaluation to be done before you set up a base station. You can also set up multiple base stations at regular distances of, say, 80 kilometers from each other and then transition from one to the other still in the single baseline without having to invest in expensive software to get your network solution based on your location. I realize it’s a little complex, but the evaluation must detail how many units you have and what surface area the workers will be on. That information will guide your decision to install one or more base stations, or whether to use a network. The cost to cover this expense can easily be paid off in a short amount of time.
QUESTION 8: Mat and James, how did you handle backups of the data that was stored in ArcGIS Online?
MATHEW: That information is stored in the cloud. However, we do bring that data in. We replace that data internally to an internal database. We call that data “The GPS Database,” and it is backed up by our IT daily. We consider that our as-built system of record.
JAMES: We use the same process that Mathew described to back up our data.
QUESTION 9: Are you feeding field data that you’ve collected directly into any other systems of record?
MATHEW: The answer is no. The information we collect with the GPS unit does not feed into other systems. However, the workflow for as-builting includes closing out a work order in our work order management system; we use an IBM Maximo solution. There are two parts to installing and closing out a work order, which is as-builting (everything that’s been installed, which is the GIS / GPS component) and the other component is closing out the work order; this is done manually by the users in the work order management system.
JAMES: We don’t have a robust work order management system in place right now. It’s one of our next big IT initiatives, and at that point, I think the data will certainly integrate into other systems. The only other systems we integrate with is outside sources; we work with some municipalities and sewer contractors and share GPS data between them.
We recently helped one of our sewer contractors set up a lightweight ArcGIS Online subscription, and they also bought an Eos GNSS receiver. They’ve been collecting data for us, but also for themselves and their own customers. We pass data back and forth all the time and share web maps, groups, and other useful data on ArcGIS Online. It’s not really a system but it’s a nice way to share data outside of our organization, for sure.
QUESTION 10: Mathew, why would you need a full-time employee for the GPS position?
MATHEW: That’s a good question. We have quite a few units out there, 34 to be precise. When we had our old GPS units before we started the barcode scanning stuff, we had someone kind of part-time managing it. But we quickly realized when we entered the realm of that ASTM barcode stuff and requiring as-built users to collect that barcode — it’s a very short window. Once that asset has been backfilled, there’s no going back and scanning that barcode. There’s no locating it afterward. So that means we had to have someone available for support all throughout the construction season. A very simple example here is when a barcode scanner breaks on-site, and we’re holding up the backfill for the contractors to backfill that because we have to get a scan. I have a guy who can get into his truck, drive to the site and get that working. Once we do that, we can get the construction going again. So, in summary, it’s all related to the barcode scanning process.
QUESTION 11: Mat, was the one- to three-centimeter accuracy you were getting for just horizontal, or was it also for vertical?
MATHEW: My answer isn’t very satisfying because we don’t collect the Z values; we don’t have a reason to. If you talk to one of my GIS admin guys, they probably give you an answer of what we get for vertical stuff. I don’t have an answer, but the one thing I do recall is that the accuracy of the vertical was not as good as the horizontal. I don’t have an idea of the numbers.
JAMES: Much like you, Mat, I don’t have the numbers offhand. I just know we’re getting sub-inch accuracy on the x and y. That’s what folks see in the field, and that’s what they like to see. We collect and store all the z values, I keep them hoping that someday we’ll have great 3D models and can use VR head goggles and find our assets, but we’re certainly not there yet. We’re collecting it, but not currently using it.
JEAN-YVES: I’ll add that regarding elevation accuracy in GPS, it is not an exact science. When you have a GPS receiver, you see its estimated accuracy, and this is not the absolute truth. But it’s a good indication of how accurate you are. When comparing horizontal and elevation accuracy, it is usually one- to three-times less accurate than the horizontal. Like I said, it’s not an exact science; how accurate your elevation is depends on a lot of things.
I advise people to use GEOID models because each country has its GEOID model. For example, in the U.S, there’s GEOID 18, and in Canada, you have a vertical datum with a GEOID model that goes with that vertical datum. So, I would say collect your 3D (elevation) data. I mean, the data you collect, let’s say you have one- or two-centimeter accuracy on your horizontal? You’ll be about two- to three- or four-centimeter accuracy on your vertical, as a rule of thumb. Again, having all those satellites make all this better and more stable. I know that Esri made some additions lately to support the Z-value into the point geometry. So all of this is collected also, and with Eos Tools Pro, we give you the tools. We give you the GEOID models so that any elevation passed on to Esri apps will be in the proper vertical datum. I encourage people to use the elevations in the data collection because augmented reality technology is on the horizon right now. So doing it correctly right now is beneficial for the future.
QUESTION 12: James and Mathew, how did you handle pairing the newly collected high-precision GPS data with your legacy data that had been digitized using the hand-drawn as-built sketches?
JAMES: Yeah, I’ll jump in there. Every time we collected data, we always tried to get our folks to collect this data before an installation. Our locator goes out there and lays a bunch of paint on the ground. I always encourage them to grab as many of those paint marks as they can in existing valves and areas. So, when I or our other GIS technician brings that back into our database, everything is an opportunity to improve our data set. So, we can always snap those lines back. If there’s a big issue, maybe we’ll send a locator back out there and put in a GPS request to go out there. That really isn’t too uncommon to find areas where we don’t have good data. One of the benefits of being a small utility is that we can respond pretty nimbly to things like that, and we can go out and inspect things and get more GPS data if we have to. So, every time we’re collecting data, it’s an opportunity to improve our system; that’s the way I look at it.
MATHEW: For our organization, we’ve been struggling with that question since 2014, when we moved to GPS as-builting. The best solution we came up with is that we create annually what’s called a standing work order. We put aside some funds for our field crews to use for GPS corrections. So as the process goes, if our field crews collect something, they can see our existing data on the GPS unit. If it’s on the wrong side of the road, or far out, they can use their judgement to say, “I’m going to charge the standing work order and finish GPS-ing the rest of this main correctly.”
QUESTION 13: Tom or Jean-Yves, is there a low-cost solution available that allows a field worker to go back to a point? For example, if a valve gets buried and it was captured with one-centimeter accuracy, what’s the most cost-effective way to accurately get that field person to navigate back to that point?
TOM: Jean-Yves, over to you. I think that’s right in your wheelhouse.
JEAN-YVES: If you take Field Maps as an example, you have a small navigation feature where you can see your location with respect to the point. It’s a simple navigation tool, you can see it on the map also.
In terms of a low-cost solution, I think it’s best to use the same unit for data collection, and if you have your RTK system. Because if you just took your tablet with the built-in GPS inside; that is only five to 15 meters — we’re talking about 15 to 40 feet. So, forget about using your mobile device for that. The accuracy is simply not there. So, use the same receiver that you used for mapping and then just navigate with that if you have RTK. We’re lucky to have RTK, because in the old days, it was not like this. It barely existed. You had to get your data in the field with unknown accuracy, head back to the office, post-process, and then retrieve your results with the computer. And then you couldn’t navigate back to the point. Today you have this flexibility with the technology.
QUESTION 14: Jean-Yves, could you explain the differences between RTK [Real-Time Kinematic] and PPK [Post Processed Kinematic]?
JEAN-YVES: PPK is a different type of real-time differential correction. The technique is different.
What we know as RTK is based on local corrections from an RTK network nearby with the network in which you are, or nearby base station. So the differences are computed and transmitted in the field.
Whereas for PPK, it relies on global information — let’s say the orbital data are gathered around the world, so that ionospheric models can be created for your area. It’s very complicated what I’m saying here, but the issue with PPK is that it takes more time to converge to get your fixed solution. It can vary from five to 30 minutes depending on where you are, and after that if you go in an obstructed area (for example, under a bridge or the trees) then you need to reacquire the signal, and it will take that same amount of time to get back to your fixed solution. So if you are in wide open spaces and there are no RTK networks, no base station, no cell phone coverage — go with PPK. And these are usually paid satellite subscriptions. So, you’re free, you don’t need base stations, but there are some limitations if you go underneath obstructed areas. The accuracy with PPK usually is a little bit less than RTK also. You can expect anywhere from below 10 centimeters, sometimes five centimeters or better, depending on the on the region.
SARAH: I’ll add there if you’re unsure about what correction service to use you can always contact Eos online, and we can walk you through it with someone in your area who kind of knows what’s available and what might make the most sense based on your specific conditions.
QUESTION 15: James and Mathew, how would you, or do you, prioritize the backlog of utility assets that need to be GPS-ed?
JAMES: Yeah, no shortage of those. We have plenty of our system that needs GPS. But once it gets missed — if a work order is installed and we didn’t have a GPS on site, or we didn’t have someone trained, or someone forgets — we will have to go out and collect it after the fact. We will have a locator, myself, or our other GPS technician go out there and locate the pipe and GPS it. We miss those barcodes, and that’s one of the big issues. We want it collected on the front end when it’s going in the ground. We’re going to get better data that way, there’s less room for error, and we get the bar codes. It’s better all-around to do it that way. Therefore, we really want to empower our field crews to be able to use these. So, when we miss them, we clean it up on the backend, usually within a week or two weeks. Sometimes it slips through the cracks, and we go out toward the end of the construction season with the GPS. Being a small system, we can do that. It would be a bigger challenge for a larger system.
MATHEW: For our organization, we prioritize what existing assets need to be GPS-ed. A few years ago, we decided that our high-pressure assets would be our largest risk in that case. So, for about three years while we did our high-pressure leak survey walks, we set up the crews with our GPS units. And they collected all 1,500 kilometers of our high-pressure installations to 30 centimeters, which has turned out to be very valuable.
When it comes to the distribution assets, we manage that by allowing the district’s field ops guys to decide what takes priority for them. They’re the ones who use the data and know where to improve it, so we leave that to them for the most part.
QUESTION 16: Mathew and James, what have you found to be the best field workflows for collecting linear assets with GPS? Is that something that you do in the field or does all that processing take place back in the office?
JAMES: I’m assuming by linear assets you mean the contours of the pipe. We kind of leave that to our field folks. We bring it up during the training — in the onboarding process, we do GPS training with them for a day, or longer if they request it or need it. But, if it’s a contoured pipe, we drop a whole bunch of points. Field Maps is really good about that; you scan the barcode once, and once you grab that point, you can copy that point and drop it along that contour of the line. So, the more contours, the more complex the linear feature, the more points you want to drop to make sure we get it right. We just kind of feel it out that way. I’m sure there are probably better ways to do it, but that works for us — it’s simple for us. And then on the backend the GIS team creates the line feature, snaps to those points, and transposes the data that we need transposed. It’s pretty slick; I copy and paste a lot of things. The other GIS technician is a little savvier than I am, so she uses some scripts that run to import all the information and do it in a fraction of the time.
MATHEW: For collecting linear assets, I love workflows. I’m always talking about workflows, like in my presentation there. What we’ve found works best for us is as follows:
Using the GPS units, the user goes out and starts collecting a line. They collect a bunch of points at each curve and deflection, including the start point and the endpoint. Afterward, the GPS unit draws that line in Field Maps or Collector, and the user scans the barcode and saves it. That’s how we collect linear features. The second part of the workflow is that the user will walk back across that linear feature and collect all the components for the pipes and get back to where they started.
That’s the workflow we found works best for us, at least.
QUESTION 17: Mathew, how did you determine your 30-mile radius for your base station? How do you monitor the health of your base station?
MATHEW: Yeah, good question. So, we put our base station up at our district office. When we first set it up, one of the first things we wanted to do was figure out how far the coverage went. What we did is we actually took the GPS unit, connected it to the GNSS tower, and tried to drive as far away as we could until we lost connectivity. That’s essentially how we came up with that radius.
The second part of your question actually goes back to one of the other questions I had, which is why you need a full-time GIS employee. For monitoring the base station, we have our GPS specialist. He is responsible for that. I’m not sure I want to quote myself here exactly, but from what I recall, he set something up that gives him alerts via email when the service goes down. Because there’s a constant service running on that base station itself. When he’s alarmed about it, he quickly gets to the office and goes to fix the physical unit in the server room himself.
QUESTION 18: Mat or Tom, before moving to the Utility Network, are there any tools that could be run against a non-geometric or non-Utility Network geodatabase with the UPDM model — where the tool could find and call out all of the data integrity failures that would need to be addressed and corrected before moving to the Utility Network?
MATHEW: When we decided to switch to Utility Network, it was literally the first version in existence. There were no tools available that we were aware of at the time. We performed a manual process which was very painstaking, to be honest. I think Safe Software FME has come up with some tools, I don’t know if they do specifically what you’re looking for, but I don’t have any direct experience with it, so I can’t comment.
TOM: Absolutely, the Utility Network brings with it the upside of basically doing some data QA for you. It is a really good tool to help you make sure your data is good and that it’s prepared to support network modeling using the Utility Network. Obviously, Mathew and the earlier adopters had a much more formidable challenge, but we [Esri] have solution engineers now and some tools which can aid people in understanding what lies ahead.
We’ll take that question and get back to the folks that asked it to learn more about their specific situation and then guide them in terms of how they can use some of those tools beforehand.
QUESTION 19: James and Mathew, do you ever have an issue where the assets are buried before the data is collected with high-accuracy GPS? If that happens, what is your solution?
JAMES: Yes. Like I said in my answer to a different question, we’ll locate it and GPS it. As long as we have the locator wire and everything was installed correctly, we’ll locate it, put some paint down if we have to, and put the GPS over it. As for the sizing data, we’ll have to get that from the work-order system if they put it in there correctly. If we didn’t miss any of those check boxes or drop downs, which is a problem we sometimes have, then we’d have to go through our facilities to see what they had in the truck that day. We can usually figure out a lot number of the pipe, but it’s a process.
So this is why we really stress the importance of getting that data when it’s going in the ground. We can get pretty good positional accuracy on it after the fact, but we’re missing a lot of the other data that we really, really want. It’s just a little more human error. If for whatever reason, that locator wire is moved or got altered during a backfill, it’s a chance for an error to slip in.
MATHEW: At Apex, we handle it just the same way you do, James. No real difference there. The keyword of the day is “workflows.” Refine those workflows and procedures, get everyone on the same page, and the errors happen less.
Closing Remarks
SARAH: I want to thank all of our panelists and presenters for joining us today. We are out of time, and we did not go through all of the questions; we have a few left, which we’ll try to answer offline in the coming days and weeks.
If you’re interested in more learning resources, we (Eos) also have free training workshops that are available. If you’re just getting started on deploying high-accuracy data collection with either Field Maps or Survey123, or even advanced workflows, you can follow that link on the screen and request a free training workshop.
Once again, I want to thank our panelists and presenters for all your time. Thanks to all the attendees who stayed on for the full hour and a half. If you have questions in the meantime, you can reach out to Eos online or Esri online.
With that, I’ll go ahead and end the webinar. Thanks, everybody, and have a great rest of the week.

