Synopsis
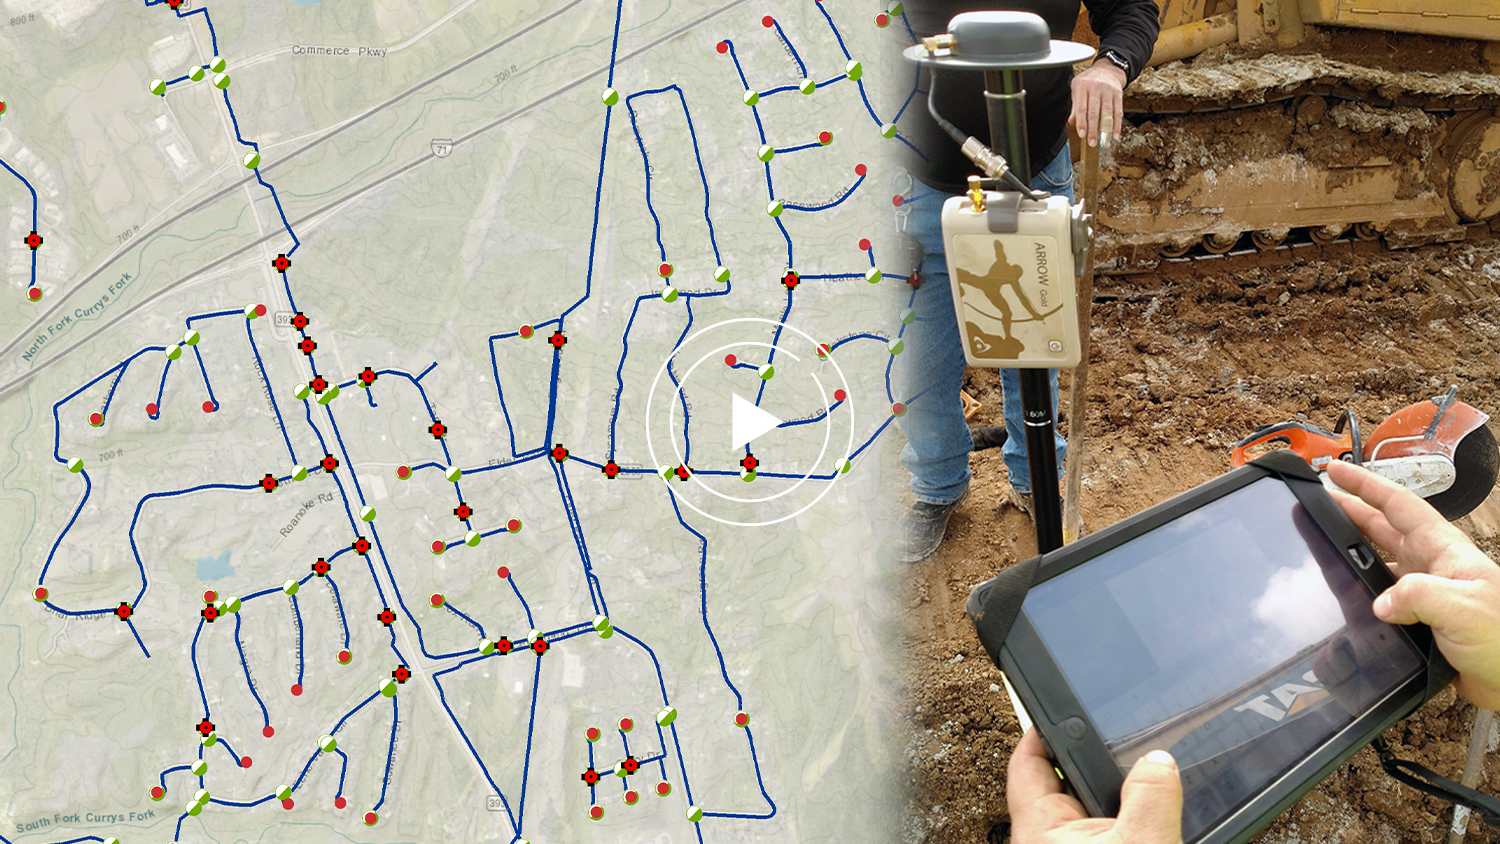
In this webinar, Esri Global Water Specialist Christa Campbell joins Kenny Ratliff, GIS manager at Oldham County Water District, to share the challenges met and benefits gained from Esri field applications paired with high-accuracy Eos Arrow Gold GNSS receivers.
Click play above to watch the webinar, or keep scrolling to read the transcript …
Introduction
Christa Campbell, Esri

Hi, I’m Christa Campbell.
Before we get started I would like to encourage you to ask questions. You can post your questions in the questions dialog box at any time during the webinar. We will have time at the end of the webinar for Q&A; this webinar is being recorded and will be posted in the water utilities space on GeoNet as well as the Esri Water Meetup group. You will receive a follow-up email that includes links to both of these locations. It takes a few days to publish the recordings so you can expect them to be available towards the end of next week. Thank you for joining the webinar; “Supporting Daily Workflows with GIS and GPS.”
Today’s agenda:
I’m going to start with a discussion about GNSS and GPS, finishing with how devices can be used in conjunction with Esri applications then Kenny Ratliff will share how Oldham County Water District is pairing GPS devices with mobile applications to collect very accurate location information within their daily workflows. In addition, we have a special guest joining for the Q&A, Jeff Shaner. Jeff is a product manager on the mobile team — it’s going to be a good Q&A.
GNSS vs. GPS: What’s the Difference?
If you have an interest in collecting accurate location data, then you’re familiar with the terms GPS and GNSS.
The acronym GPS stands for “Global Positioning System,” which provides users with positioning navigation and timing services. You might not know that GPS is a US-owned utility that is developed maintained and operated by the US Air Force. The system consists of three segments; the space segment, the control segment, and the user segment. We are the users, we take advantage of receivers that provide an accurate location for our assets.
GNSS is an acronym for the Global Navigation Satellite System. It’s a general term describing any satellite constellation that provides positioning navigation timing services on a global or a regional basis. While GPS is the most prevalent GNSS, at least for us in the U.S, other nations have their own satellite systems. For example, the BeiDou Navigation Satellite System in China, Galileo which is owned by the European Union, the Russian Federation’s GLONASS — you’ve probably heard of that one. The government of India owns a navigation satellite system as well as the government of Japan. The United States developed cooperative relationships with these countries as well as others and the purpose of these relationships is to encourage and create compatibility and interoperability.
So although GPS is used as a generic term, there’s a difference between GPS and GNSS. When you’re talking about receivers; GNSS receivers are capable of using various navigation satellite systems, while GPS receivers can only use the navigation satellite system called the Global Positioning System. But be warned — in many cases, GPS is used to describe receivers that are not limited to the global positioning system. They’ll connect to various satellite systems and technically they’re a GNSS. But GPS is used by many as a generic term. The industry doesn’t always define the differences.
Choosing a GPS Receiver


When you’re choosing a receiver, check the specifications and ensure that you’re purchasing what you need. Before you use a receiver with Esri applications, you need to think about your data.
You need to prepare your data to include GPS metadata fields so Collector and Survey123 can write GPS metadata to the respective fields, and story metadata can be valuable to access data quality and to ensure data collection standards have been met. If you want to store metadata, you need to prepare your data ahead of time and make sure those fields are there so that the receiver can store the data in your geodatabase, or your feature service, or whatever you’re using.
When choosing a receiver, be sure that it supports NMEA (National Marine Electronics Association Messages). NMEA messages contain lines of data called sentences. Collector and Survey123 derive information such as latitude, longitude, height, and fixed type by reading specific sentences that are in these NMEA messages.
Not all receivers are configured to use NMEA — in most cases, though, you can configure this quickly using the receivers companion app. Collector and Survey123 support external receivers connected via Bluetooth. To connect your receiver, you need to turn on your tablet or phone’s Bluetooth setting. The receiver’s name should appear in the device list (you’ve probably done something similar to this when connecting maybe a headset) and then once you’re connected, you should be able to set the receiver as the location provider.
In some cases, it’s not easy connecting and setting up your receiver. It can vary depending on your device, your receiver, if you’re using a pole or if you’re mounting the receiver to a vehicle; you need to enter information that accommodates for that hole or the distance of the mount. There are also additional steps; that you’re using maybe real-time correction, then that’s something that you’re going to need to configure. It’s important that you understand what you need and how to configure and set up your receiver.
For receivers, Esri partners with several organizations that provide high accuracy receivers; Bad Elf, Eos Positioning Systems, Garmin, Lika, Xblue and Trimble receivers can all be used directly with Esri applications. Getting back to the applications, I talked about Collector and Survey123, and these applications are designed for field data collection, so they’re the most commonly used when pairing with a high accuracy receiver. From this slide, you’ll see that I’m also mentioning Explorer, Navigator, and Workforce. These applications take advantage of the location provided by your receivers, but they’re not used to collect location, and Kenny’s going to talk a little bit about using Explorer.
This was a quick overview of GNSS and GPS, and I know a couple of our Esri applications, but there are a lot of details that I didn’t discuss today. The bottom line — do your research. There is a lot of information on our website; the Esri website. You’ll find detailed information about products, the compatible receivers, how to configure them, and a lot more. There are step-by-step guides that help you set up your receiver with your application to start collecting data. Now, if you have problems finding this information reach out to me and you can contact me via the webinar. Many of you have my email address, just let me know, I can help, I can send you links to information or I can connect you with Esri staff. Now it’s time for a polling question.
Audience Questions (Poll)
- Are you using a high accuracy receiver with Esri application or applications? Yes, No, You plan to in the future.
- Are you using a high accuracy receiver with an Esri application? Yes, No or you plan to in the future.
Okay, about 80 percent of you have voted. I’ll give the rest of you just another second or two to get your responses in. It looks like a pretty even distribution of responses — about 36% are saying you plan to in the future, 34% are already using it, and 30% are saying no, you’re not using the high accuracy receivers.
Joining us from Oldham County Water District is my friend Kenny Ratliff. Kenny is a GIS manager at Oldham County Water District. He has more than 20 years of experience working with geospatial technology and supporting GIS initiatives, including the use of GPS technology. Kenny holds a degree in geography and a degree in geology. He has been in his current role at Oldham County Water District for three and a half years.
About Oldham County Water District
Kenny Ratliff, OCWD

Thank you, Christa, for the introduction, and a great job in explaining the lead-in there on some of these components and the technology, the apps, and the tools available. We certainly appreciate the opportunity to share our experiences on this topic and as you know our goal is to help others and provide something in this content that may be useful to those that are out there.
So, a couple of things. Obviously, if you saw the picture that Christa showed of myself, we don’t have to worry about any glare off of the bald head since she’s doing a webinar. So you guys are good there! Unfortunately, it won’t keep you awake necessarily, so we’ll try to keep it informative and light and have some fun with this.
I did have a little scare as Christa started the presentation — I noticed down here in my date that it was showing November 13th, and I thought now wait a minute, I know it didn’t mess that up. As I clicked, I realized it was the last edit date. So that tells you that number one, I was not scrambling at the last minute to get the slide show ready. This story map shows November, today, but it was prepared yesterday, in the dead of the day. So that being said, let’s jump into today’s topic. Just a little bit of background about our system, our infrastructure, and then I’ll touch on some relevant history.
We have a little of over 8,500 meters that are out there serving our customers. Our population in the county is certainly a lot larger than that. We’ve used GIS technology for quite some time. To discuss our location proximity, I’ll show you a map here in just a second.
We are in next to Jefferson County, Louisville, Kentucky. There’s 120 counties in the state, and we are still considered one of the four hundred and some-odd rural water districts, even though we are probably in the top five in terms of size of system and customers and that type of thing. Our water source is from ten wells, and they are along the Ohio River. They do not draw from the Ohio River — it’s all aquifer fed, and we’ve got about 370 miles of water main with our 13 tanks for storage. You can see some of our water use in capacities, and there 1.2 billion that we treat annually for that particular aquifer.

So, to give you a sense of, again, where we’re at — this is a public-facing map that we have on our website that’s designed for new or potential customers. Someone looking at the area can type their address in and determine if they’re inside of our service area or not. I’ll point out that to our east, we have a couple of water districts, other rural water districts; Tremble in Henry County, we have LaGrange, which is in our county. That is the county’s seat; incidentally, we actually wholesale water to LaGrange from our system and then as I said we are next to Jefferson County Louisville, and Louisville Water District comes into a good portion of the western side of our county.

Just a quick map showing our well field location. Like I said, we have our ten wells, and they’re all aquifer fed. So we have that cleansing done before we ever pull the water up, so there’s a lot of good filtration that occurs from that aquifer. It’s worthy of note that even though we do not pull water from the Ohio River directly, if there’s an oil spill or some type of chemical spill upstream, just more as a PR move we’ll shut our pumps down and won’t pull from our wells as that passes by, just to make sure our customers feel good as well as ourselves.

Westport is where all this infrastructure resides, and you can see the location of our water treatment plant near the well field. So. just a picture of a couple of the wells. Actually, there’s three in this picture, but you can’t see the third one. This is what the bottom looks like next to the river and incidentally, there was flooding and this pic was taken at that time. It is one of our most recent flooding events and happened about a year and a half ago; I think water levels came up to roughly halfway up this fence. Obviously, our Thompson piping extended above it, it’s a 100-year floodplain. So we get that natural filtration before it reaches the water treatment plant.

We have ten pumps and we have a two million gallon capacity clear well off to the right side of the building. We have a SCADA system that we use to monitor all of these devices; our pumps, wells, and tanks, and you can see the antennas there from the treatment plant. Incidentally, we have hyperlinks in our appropriate layers to pull up that SCADA information from our map, or web Maps, or our office maps by our staff members.
Follow along with Kenny Ratliff’s StoryMap here
I’m using the new StoryMaps if you are familiar with that, so it’s a little bit different than the old one. So, I’ll kind of take my time working through these slides. So what are we going to really talk about today? Just really briefly, some bullet points; highlights of our history using GIS and GPS, because it’s part of the big picture and the long term that brought us to the point that we are now. You guys would actually want to hear what we’re doing with the newest stuff — it all builds to that crescendo. Then we’re going to talk about how we’re using the latest developments and techniques in our daily workflows, mainly with focusing on our field crews. Then, we’re going take a look at our 811 locate processes as well as our new construction.
Bill collection processes have really evolved in the last couple of years because we have the accuracies available and we have the units. They’re cost-effective now to employ with Collector and the tablets. So a lot of things are coming to, I guess, a tipping point there. So we’ll jump through the history real quick.
History of Oldham County Water District

Initially, mapping back in 2001 was a more or less a part-time assignment and the staff that were working with it weren’t really formally trained. They had limited training, but still did a great job in spite of that. They set up the basis of our mapping system, and then in 2007 we adopted the Esri ArcGIS solution for local government database template. That gave us the structure that we have since built on by adding attribution or new layers as needed, but using that same sort of template from 2007.
Many of our representations of water lines and infrastructure came from a lot of older maps that were scanned in and digitized on, and sometimes they were red line drawings that you can see displayed here, other times they were just drawings that we worked off of as best we could and may or may not have been accurately digitized in.
I did forget to say that in Oldham County Water District, we have infrastructure that goes back as far as I think 1954 or thereabout. Oldham County Water came into existence initially in the early 60s and then about 1980 we became who we still are now. So, then this initial movement into the GIS and mapping world came along with this Trimble unit, which was a map grade unit at that time, GOXT. It was capable at the time of collection for submeter, as a general rule. As many of you are probably familiar, with there was a post-processing procedure that you treated that data against data from other stations that were scattered around, and you could eventually get a 30-centimeter accuracy with this particular unit.
Then in 2013, we actually purchased a sub-entry-level, a survey-grade unit that was capable of real-time corrections at the time of collection down to a centimeter, or a better level, and it would also give you that accuracy on the vertical or the Z as well. This unit, because it was a survey-grade versus map-grade, it was a little bit more cumbersome of a process to collect with. It was the only unit we had available and you had to connect it with a cable to your computer, export it as a shapefile, then you bring that into your map and digitize it into whatever geodatabase that you would be using. But it was a great jumping off point and a part of our evolution.
2016 is when they hired a full-time GIS manager, together you see me with the hard hat. As a side note, I just wanted to show my hands there for you Dukes of Hazards fans, may be playing in the background Waylon Jennings songs about showing my hands on TV and not my face, so his mother has a little apology but I didn’t do that.
So once I came on board, I took a stock of what we had in terms of software equipment, learned what the processes have been in the past, how things were operating at the time in regards to mapping and collection.
Updating a Legacy Workflow
We pretty quickly determined that with the commitment from Oldham County Water to go with a full-time person to do the mapping, it was worth investing in maybe some different technologies will make us more efficient. This included signing the Small Utility Enterprise License Agreement with Esri at that time. So even with that ELA in place, it was difficult to capture things that were going on in the field with the one unit, so there was kind of a dedication of time to the office and also working with the software.
While configuring the system we did move to a true enterprise GIS, and I’ll talk about how that’s set up; we’re kind of a blended system in that regards. However, we missed a lot of opportunities because things would be put in, installed, or repaired, and we just couldn’t get to them for whatever reason. Off-hours or on weekends, many of the guys were not familiar with using the unit. It wasn’t the easiest to operate if you hadn’t done it in a while.
So we had one repair that wasn’t missed, that really enforced our need to find a different workflow, and that was on a small road in the north part of the county. The system map showed that the water main was running along a curve on that road, and then one early morning we had a rupture. Once we located it, we determined that that main was actually about 46 feet over in the field, across the fence, from where it was actually shown on the map. So the significance of that is if someone’s developing, or doing work, or putting trees in, and you’re asked to go out and mark these lines, you may think you’re marking on our spot when in reality you aren’t and something bad could happen to the system as a result.
So we had had minimal experience with Collector at that time and we started to look at how we could better leverage that with our field staff. That led us to look more at the availability of these high accuracy GNSS receivers.
Choosing Eos Arrow Gold

So we did research, we looked at two to three different brands models that were out there and it eventually came down to the fact that the Eos Arrow Gold was a very good unit with a good price point, and it had different levels of accuracy available. Our CEO is adamant about accuracy and one of the big things for him is elevation. At the time we were looking at these, the elevation was just evolving, and I am happy to say that with the units we have (the Eos units), we can get centimeter accuracy from the vertical as of several months ago, as well as on the horizontal. And again, we’re doing this with an RTK connection.
I was going to show you the Kentucky CORES website but I think they’re having some problems with that so I’m not going to attempt that but just describe it. Kentucky CORES is our Kentucky Continually Operating Reference System and it’s a series of towers. If you’re familiar with the National Geodetic Survey, they have some of those which is what the old GeoXT units used to draw their information from. When you did that post-processing correction, it was just coming over a hardwired internet connection.
So now we’re able to do this with Bluetooth in the receivers to our tablets using the middleware to connect into the Collector apps or the Survey123 apps and we’re getting that real-time centimeter accuracy as we go.
One of the biggest reasons that we went with the Arrow Gold unit was something called SafeRTK. What that does is, if you are in a good signal area and you’re getting the real-time corrections from that antenna network, and you drop off into an area (say down in a hole, like our staff member is here, or under some tree canopy) and you lose that real-time signal, the unit computes that, continues to compute that, for the next 10 to 15 minutes. So, you can actually walk up the hill, which I did recently on a meter collection. I got a good signal, walked about thirty yards back down the hill, went under the trees, and I still came out with .4 centimeters accuracy without what you would call true real-time connectivity.
So, before we signed on to the Enterprise Agreement, I was the only AGOL named user; we only had one user with the software that we had, and I found out that as the day would evolve, we would have guys putting new meters in, fixing a small leak of repair, they would uncover the main, fix something, cover it back up, put a flag in the ground, and then they may or may not remember to tell me a day or two down the timeline, “Oh, by the way, we did this at this address, you may want to go out and collect it.”
So what I did initially was that I started writing that down as they came in with sticky notes, tried listing it into a spreadsheet, I thought ,“Well hey, I’m a map guy, so I’m gonna make a map.” I created this field communications layer which was a hosted layer in AGOL, and it retains attachments, which is nice, being up in in the cloud there. But that was for my benefit initially with tracking what needed to be done.
So, I would just generically throw a point on the map and put the information about it. The list is meters, valves, water main locate points, hydrants; things that we would commonly be working with. So, I set that up for my benefit initially, and then as we went the path of Collector and more named users with the ELA. we decided to build on that layer and allowed our guys to collect using that layer. Then I would, in turn, digitize from that into our definitive geodatabase or STE enterprise database.
The New Workflow: Arrow GNSS and Esri Collector
This is probably a good place to point out and talk about our configuration. All of our infrastructure layers, or water lines, or valves, or hydrants, or water main locate points, which are essentially, when we uncover, when we capture it, with GPS that is a layer that we consider one of our infrastructure layers. All of those are served from our guest server from our server on the premises.
So we have those there, they’re essentially presentation layers that we put out for our guys to use, so that they can reference our infrastructure map on Explorer, or they can even go out and use some of those layers as a reference in our field communications Collector application. Our field communications layer as I said, is hosted in AGOL and there are a couple of different benefits to that; one being the attachments to it is getting backed up by Esri. It’s not bogging up our servers or things like that.

They go out and they take the GPS and Collector combination and they’ll collect the new meter, or they’ll collect the rupture and the fitting that was used to correct that, and then I will come in and we’ll perform the editing process in ArcGIS Pro to take that point you see here on the map to our enterprise system.
Let me see if I can just go live here and zoom around and give you an idea of some of the things we are doing. We’ll end up out here shortly, but there’s the information that we’re collecting; so we have our need and our description. We want to evolve this a little bit more — more domain-driven options to describe what the guys are collecting. But you see here we’re getting about a half of a centimeter accuracy on the horizontal and 7.7 on the vertical. So, nobody took a picture there with that, but with these things we can collect out in the field.

So I had to throw in our guys being as happy as pigs in mud, you can certainly see I think, body language speaks volumes there. But not only did we want to use this fill collection process for new installations, but I mentioned the repairs and breaks and ruptures. This is an instance we have with a rupture, we only have one valve at this Junction, this T, at that time and this provided us the opportunity to reconfigure that so that in the future, we could isolate and have fewer customers without service from this particular area. Once the repairs are made and it’s GPSed, I can see that point almost instantaneously in the office and can plug that into the system. And again, we’ll touch on that workflow here shortly.

So, our first unit, we assigned that to one of the field crews to work with and they did so, it was very successful, so we ended up picking up a second unit and providing that to our second field crew. And as a part of their workflow in the field, anything that we uncover, install, if we’re going out, we’ll go through subdivisions and GPS existing visible things like meters and patterns and valves just to make those corrections on the map, because we want our system to be represented as accurately as possible.
This is just a quick illustration, it’s hard to see the text on this particular shot but we had a small leak on a three-inch line here recently. Our guys went out and fixed that, GPSed it, did a lot of work. The is the field here, the water locate point, and you can see that we ended up from the actuality of what that line is about almost nine feet difference from where it was portrayed in the map. That can be huge from when we’re going around, especially on a three-inch line, if we want to locate that for future work like construction activities. We can go back within a few inches or less with our unit and relocate that point to mark it. So that’s a huge win as far as we’re concerned.
The Results
After several months working with this these new workflows, with the new equipment and the configurations, we did a semi-formal return on investment evaluation of how this was helping us. We were able to show that using this Arrow Gold GNSS receiver and Collector GNSS/GIS pairing, that for just installing new meters, we essentially cut our cost in half on the per meter installation. And that’s just considering labor and fuel. We mentioned that to the Eos folks and they were kind enough to do a little success story about that. You can certainly go and find that on their website if you have some interest in a few more details.
In our next section; “Line Locate Request,” we’re using this workflow of our GNSS, GPS and GIS to help in this aspect as well. We want to come at this from a couple of different directions; how we document using Survey123 (I don’t have any real slides here to show that Survey123 interface, but I’m going to show you the results of how we use it). We don’t currently use it with the high accuracy receivers but we are looking for ways to leverage that for the future. We may be able to go out and relocate using the Survey123 app with the receiver for points that we’ve already collected, but we’re currently doing that in Collector.

Most folks will be familiar with this. I think every state has a requirement to call before you dig, whether you’re a contractor, homeowner or utility. Kentucky does not mandate membership to Kentucky 811, but that could change in the near future, there’s been a couple of efforts in legislation to mandate that. But currently, we are not members, and what that means is a person may call Kentucky 811, request markings, and that organization will contact the gas service, the local telecom or the local electric service, and they’ll get the information to go out the request to mark the infrastructure. We won’t, so the person has to call us directly to make that request and at that point, then we’ll go out and do the same kind of markings.
So, here are the results from us using our Survey123, and we implemented all these about a year and a half ago, so these are not high accuracy collected points, but they’re using Survey123 to document when we go out and do a locate. I’ll zoom in and give you a sense of how that’s set up. I’ll tell you why we implemented this as our tracking CYE system.

Challenges and Solutions
So here it is, quick and down and dirty: when we visited the site, who did it, what our tracking number is, most area marked by the requester, is it in and out? How do we mark it? What do we mark it with? And then we have up to five pictures that we can add to show what we left after we completed that project or that work order. As you will know, sometimes people will mow yards and they’ll pull flags that they don’t like, or even the paint in their yard, so those things can disappear but we want to make sure that we are able to show that we did do what we were asked to do.
Even though you mark those things, sometimes ruptures, strikes still occur. The driver for us on the Survey123 implementation was when we had a request, we went out, we marked a couple of lines that were in close proximity to each other with paint and flags, then the horizontal boring group went out, they hit one of our lines, so we had to go out and much like the guys here we had to repair the leak.
I went out because at that time we had only one Eos unit. I went out, captured the fitting, the repair, and took some pictures which included the flags in the ground, and the paint in the ground. But at that time the archiving I had was going to a shapefile that did not retain attachments. Actually, on the day of that break, I had been working and moving that to a hosted archiving area so that those attachments pictures would be retained. Unfortunately, that didn’t come on board or online until the day after the particular break.
So several weeks later when we billed the contractor for the strike they came back and said, “Well, you didn’t mark the lines, you have to prove it to us that you marked it or we’re not going to pay it.” So there was a loss of a significant amount of money because we did not have photographic proof. So we now document using the Survey123 and we can access that at any time to another little tool that I’ve just recently started setting up, the attachment viewer at the web app builder.

So if some cases on the locate side… I’ll try to speed this up just a little bit to get to some of the other stuff on the new construction side, but sometimes we want to make sure that the things are where we think they are. This scenario happened just last week, the property had changed hands here and we were asked to go out and mark where our lads were. To make sure, we’ll go out and dig a hole and GPS mark that line so that we can correct it on our map as well as mark it for the requestor. The interesting thing there is, we have to request a locate to go out and do the locate that we want to do, so that’s just an interesting round-robin but a 811 locate processes are kind of interesting animals some days.
Here you have our guys, probe for the line to get a good idea of where it’s at, and then we start digging to find it, once we find it our guys will GPS that with our receivers. In this case, the operator on the tractor is capturing that from the receiver on the tablet and then they’re going to cover that back up.

So this is the Explorer view of that field communications map, and that point that you just saw being collected does show that we were about a little over 6 feet off from what our map represented. It’s a significantly sized line, so we certainly want to make sure that we have that mapped accurately to avoid any damage. In this case, we’re getting 8.8cm accuracy on horizontal, sixteen thousandths there on the vertical, and I have added a field to that template model as it were with feet because the Eos device comes in meters, captures in meters, and I have a model builder process that I’ll run before I start digitizing this in order to populate that actual number into the enterprise database. So back in the office, it’ll pop up really quickly, and I can see that just by hitting the refresh button, and then I’ll start my editing process.
This is a video that I shot, instead of trying to do a live demo, which we all know can go south sometimes on the fly. The video walks through the editing process from field collection to our enterprise data. So I’ll pull that up, zoom in, create a new feature, once I’ve created that, snapped it to that water locate point, I’ll go in and feel the attribution in. I’m going to let this video roll a little bit longer and I’ll go through the following section video a little quicker because it’s essentially the same process; editing workflow, whether it’s a new construction or an adjustment on a water locate or any other activity.

So I’ll type in the attribution. If you’re not familiar with ArcGIS Pro, you should be. I’ve forced myself to go to the latest version 2.4. It seems to have almost everything that I need to do my job as I did it before in the Arc desktop software. I did find one thing the other day that I missed and I’m going to have to quiz on that and figure out the workaround or if it’s just hiding somewhere.
“GPS date” — this is information that will be available through the infrastructure map. The created date, if you missed it here the created date’s last update date, I fat-fingered that so that should line up. And then if at some point I make a change to the attribution, or to the pointed later date, I’ll update or change the date in the last updated field so that someone will know that that’s recently been adjusted in the GIS.
So, once I get this second point digitized in, you’ll see when I turn the fieldcomms layer off, this little target, a little purple target/bullseye, you can see it floating across there. And then all I’m going to do is snap these lines, create vertexes, snap the lines in, and adjust that to actuality. It’s a pretty straight shot so I don’t have to worry too much about leaving vertexes between these field-collected points.
So I’m going to move on along, Christa, I think I’m doing fairly okay on time.
Christa Campbell
Yep, you’re doing all right. We’re going to have a few minutes for Q&A. So we’ll just let you keep going.
Kenny Ratliff
Okay, so I’ll skip through the videos just to touch on some of the bonus material I had as a backup, just in case I was not long-winded. Which for Christa and Jeff and those folks that know me, that’s typically not the case, but always a concern.
The New Construction
So, our new construction. Once it came on board, Oldham County began to require that all installation information be captured by our internal staff with a GPS. Once we transitioned to this GPS/Collector workflow pretty much anybody could get out there and do it. We ended up picking up a third Arrow Gold unit in order to be kind of a floating unit and that we could respond out. So the workflow here is our on-site inspector/watchdog; they’ll notify myself, or the field supervisor, that toward the end of the day there will be points in collecting. We’ll go out, we’ll collect that, I’ll process it back in the office. And moving from the Juneau unit to this workflow, it became a lot easier just to get from field to map.

I’m going to move to the next slide. Why don’t we do a quick example of a leak we had on a small line on a subdivision? Typically our meters are between the waterline and the structure, which this is the original map before changes were made, but once we fix the leak and GPSed it, we noticed that the line actually ran more over here, which would mean that this meter was probably not where that meter says it’s shown on the map. So we GPSed those meters, corrected those, and this particular one there’s a three-valve configuration to the left and we were actually able to grab those and correct those locations as well. So, we have a much more accurate map now.

Going back to that, referencing the last slide, why do we want to be that accurate with things like a meter lid or a valve? In wintertime, we get snow and we have a lot of leaves that fall in the fall in different areas, subdivisions, and out in the rural parts of the county. Some of these meters can be hard to find when we go out and we’re required to read them every so often. As a matter of fact, we have one meter that was over a hundred yards from where it was shown on the map. It took three of us about an hour to find it and we finally found it, and GPSed it in the right spot. So, now these guys as they look at the map they know they’re going to have more confidence in going out and finding pieces of infrastructure that may be covered up.
This is just an example of what you don’t get to see in a generic collection. Using our field communication archive, we can describe it. We also had these pictures to show that “hey here’s what it looks like if you’re digging around these fittings.”
So, this is the other soup-to-nuts video that I’m not going to belabor. Those target points that you see are bales. So we shoot every bale, essentially every 20 feet on new constructions, we shoot all the fittings, the valves, the hydrants, etc. So at any point, we can go back again within inches and relocate that using our GNSS receiver/Collector workflows. The only difference with this particular workflow is, as opposed to adjusting a line, I’m just creating a new line and connecting the dots, extending that each time we collect additional construction.
This is just a quick video of archiving or closing out that field comm point. So, in the case that we’re just looking at in the previous video, this new construction I’ll simply go in and because it’s a hosted layer at AGOL, it’s just a little easier to work with. But I’ll pop that up and this one was closed. I put it into the GIS on October 30th. The information is still retained from that field communication point. As for the one that I just digitized in the previous video, I’ll go in and make those changes in this attribution as well. So I’ll just do an edit, close it out the, save the date that it was put into the GIS and then how I resolved it and it’s usually added to or adjusted.

To date we have archived, I think it’s just over 3,800 points, and that’s all these pink dots that you see on the map. I’ve got a web builder product that we will gloss over here in just a second that myself, the supervisors, can look at to determine if he wants to go back and find an archived point or if he wants to see what’s assigned to who on the active field comms layer, that tool will do that.
At any time, someone can go back to this archive point. Again, I’m just implementing the attachment viewer which just came out recently with AGOL, it’s one of the web builder options. This is a recent new construction that was completed and you can see the number of points that we collected over the duration of that project and you can essentially see the outline of the subdivision. But if we want to go, Mike and our guys are going to have to repair something, they can pull this archive point up, they can see what was put in, the sizes, and then we can come down and check out the photo of it, and they know what they’re looking for. So, we think that’s helpful, our guys think that’s helpful to have that — it’s just additional intelligence that they can utilize and make their job more efficient.
Bonus Materials

So the bonus material, I’m not going to belabor on this one. I’ll skip through and leave a couple of minutes for questions or comments. Unfortunately, you guys can’t throw tomatoes or rotten apples or anything at me on a webinar. Feel free to send me something over social media if you’d like, all those ugly faces, or whatever.
This is just a dashboard that I created showing the status of these field comps. One of the nice things about it, you can see, I’m way behind. So the closed-door ones that have been digitized into the enterprise are under review. We have something that the guy collected it the person in the field-collected, it was considered open, I saw it something digitizing, saw something that had a question about or we need to go back out and revisit it or do something about it, so that would change the status to under review and then the game will close it out.

This is just an archive, the graph showing what we’ve archived over the time frame. One of the nice things, if I want to quickly see, is that I’ve got 93 open field communications to address. I can click on that and this breaks it down further by activity for me that I’m looking at and it also filters out the points so I can see kind of where I need to go on the map to do those edits.
“Locate tracking,” just another dashboard, we do have a current record, somebody’s gone out. James has gone out and did a probe marking, tracking our numbers overall year-to-date, and then this is a map again that they can go in and pull up and see information about locates we’ve conducted.

This is the reporting tool that I mentioned that myself or Brian or supervisors can go into, and they can look for archives or field comm points and just pick somebody. Again, this, pick me, show the opens. Let’s just pick one of, let’s just say spot locates, hit apply and then that will highlight and filter the map with those particular points. Then I will start working my way down through as a means of tracking my edits or what I need to put in from the oldest to the newest. I’ll just scroll down through there, go to the next one and continue to digitize those in.
Alright, Christa, I’m just about to wrap it up. So what does the future hold for us?
I’m going to let you all read Russell’s comment there, but in a nutshell, we want to make things as accurate as we can, and it’s really about the future. We want those guys 20 years from now to look back and appreciate how we may have made life a lot easier and more efficient for them. That’s what it’s all about. It’s just getting better. And the tools that are evolving, the ones that have evolved, are making things a lot easier, a lot nicer.
So what are we doing to do in the future? I mentioned the legislation that might dictate an additional unit configuration. Our locate request that we get may go up from roughly 800 or so to maybe 5,000, if we’re mandated to be a member of 811. We’re going to continue to expand our GNSS collection, I’d like to do that especially with the Survey123 capability.
As Collector evolves there are some things that are coming on that I’m privy to, I won’t steal Jeff’s thunder, but there are a couple of things that are going to really be nice here in the near future I think. So, we want to update our guys and make sure they’re leveraging that capability going forward.
You May Also Like One of These Success Stories

Customer Spotlight: Kenny Ratliff Innovates with GIS Workflows
Meet GPS power user Kenny Ratliff, whose work has brought ROI on Oldham County Water District’s GIS investment and improved service to county residents.

Capturing Hard-to-reach Assets with Decimeter Accuracy
In this Esri AEC webinar, DDSI Global shares how per-project ROI increased by 20% thanks to the use of Eos Laser Mapping for Collector during site surveys.