Synopsis
In this video, Mike George gives his DDSI Laser Mapping Presentation at Esri GeoConX in Dallas, Texas. Faced with strict constraints on project turnaround time and budget, George wanted to find an extremely high-accuracy field mapping solution that eliminated some of the challenges of legacy technology. For instance, George needed a highly mobile, highly accurate laser mapping solution that reduced interference with GPS signals and also allowed crews to shoot multiple types of utility assets. He preferred a solution that worked on popular mobile devices, such as iPad® and Android tablets. He also wanted the solution to work in real time, enabling both in-field quality control as well as enterprise-wide information sharing of data that was collected. He describes why DDSI—a telecommunications and utility consultancy already familiar with GIS—selected the laser mapping solution in Collector on iOS®, a 2018 solution jointly released by partners Eos, Esri and Laser Technology, Inc.

Transcript for “Video Case Study: DDSI at Esri GeoConX”
![]() Mike George, DDSI: Okay, Thanks everybody for coming.
Mike George, DDSI: Okay, Thanks everybody for coming.
I’m going to talk a little bit about some of the work that we do [at DDSI] with some of our products in the wireless industry. As Randy [Frantz from Esri’s telecommunications team] was saying, we work in a few different key sectors. One of them being is in the oil and gas sector, where we primarily do data management, preliminary routing, ROW (right of way) staking, as-built survey, and drafting services.
We also do wireless telecom, which is what I’m talking about today. We work with a handful of architecture and engineering firms that sub-out their contracting work for surveys that they need to green-light their projects. So, going a little bit off of the last presentation, one of the main things we do is tie down right of away (ROW) and cross the boundaries. So that’s one of the first things we have to do: look in that for the boundary. That’s a key part what we do. And then we also do commercial and residential surveys through an iterative shot. You can see that there, next to a field of us surveying a downtown project.
What I’m going to go over today is pretty much technology that we employ to do the telecom projects. We’ll be focusing on one project in particular today. The case study itself is applying the high-accuracy technology that we’re trying to incorporate with all of our field tools that we use, and pulling it all together with GIS. After that, I’m going to briefly talk about some high accuracy technology trends. Before I get started, I guess I should make a quick note that this was going to be a co-presentation. Today I was going to be presenting with someone that had a little bit more technical knowledge on GPS, but he had a family emergency and could not make it. So I’m going to try to fill up as much time as I can in that aspect. Hopefully, I’ll be able to give you guys enough details and we will have some decent questions to go over afterward.
Technology Used
![]() For this project, the technology we employed were [these]: for the GSI we used ArcGIS Online, ArcMap, ArcGIS Pro and AutoCAD Civil 3D. For the GPS systems, we used Eos Arrow Gold system. The real-time correction that we used is Virtual Reference Station (VRS).
For this project, the technology we employed were [these]: for the GSI we used ArcGIS Online, ArcMap, ArcGIS Pro and AutoCAD Civil 3D. For the GPS systems, we used Eos Arrow Gold system. The real-time correction that we used is Virtual Reference Station (VRS).
In the Denver Front Range area, we’re lucky to have a couple of VRS systems that are publicly out-facing, which anybody can tie into and use. We’re able to get real corrections, essentially sub centimeter from these providers at no cost. That was a real key to the success of the project. So that range is pretty much all of the known Denver Front Range, which helps us out. We’re also using the laser rangefinder LTI TruPulse 200X and the data collectors we used were an iPad Mini® 4, a Samsung S9 with a Touchpad (Windows).
As you can see there are a variety of different devices that we’re able to use. The mobile apps that we tied together were Esri’s ArcGIS Collector, the Eos Tools Pro app that goes along with the Arrow GNSS unit, and then for the UAV that we used was a DJI Phantom 4.
Project Overview
So this is just a kind of overview of where this project is at. What we’re looking at here is the compound center with a monopole. Essentially the scope that we’re looking at was, we have to do boundary search. Earlier somebody talked about tying down the parcel boundary so that as they built the compound, we could pretty much go in and do topo for all the existing permanent structures that are on the property itself.
Another key is underground utility locates. It’s not required for all jobs, but this one needed us to locate where fiber was running in and out of the property. It is something we contract out as a side because it’s not a service we provide. A private utility locates company comes in and performs it for us. We proceed once they’re done with the locates themselves. We then survey and add it to their locates as an added deliverable.
Here’s an overview of the area with imagery that we took with the drone. We got high-resolution imagery, essentially 1.5 centimeters of pixels, that we’re able to use for drafting and queuing the data. You can see the lease area that’s on here; this actual property is like a construction goodwill site, where people bring in their leftover home improvement projects. As you can see, it looks like a junkyard but it’s not necessarily one. It was very busy when we were there. People came in to look for extra stuff for their projects or they did it themselves there.
What we’re overlooking in this slide is: after they’ve gone ahead and done the locates. In this scenario, we can see the locates pretty much clearly. So what we have is the communications’ type highlighted in orange [for] fiber lines, electric power in red, and the hand holds.
Limitation 1: Capturing H frames where they are
 I didn’t have a laser rangefinder. [So] you can see the monopole in the center there, and then there was four separate “H” frames with equipment on it. So that’s something else that was wanted, we needed details for the global. They wanted to have a shot to know where their “H” frames are at. They’re essentially trying to figure out how much more equipment they can put out on the site, how many more users (providers), can they put in the same location, giving the existing square footage and what’s already been there.
Limitation 2: Budget
So over here is the northeast corner of the property, this is where we started to run into a little bit of an issue on the field. I also have to point out: these jobs are low budget. So for a survey side, my goal as the project manager is to make sure that we get it done as efficiently and quickly as possible. We’re not really allowed to go back out for a second visit or take an absurd amount of time to collect the features. If we do, it essentially blows the budget on the project. So we have to try to figure out what tools we can use while we’re there on the field and at the same time make it work.
Limitation 3: Accurate collection of multiple utilities under an obscured area
In this situation we’re looking at multiple utilities under this obscured area; it’s the tree canopy there, and if we were going to traditionally try to collect it, we’d have difficulty just using our GPS equipment, which is the fastest means. You can see in the lower left-hand corner that there’s existing equipment that we need to also tie into the property that we can’t see from the imagery. It has to be collected somehow to and be accurately displayed in the deliverable.
Here’s kind of a ground view shot in that same area. We’ve got a multitude of flags and it’s very confusing. There are four different utilities here: a water line, gas line, there are five different comm[unication] lines. Three in this section right here. And then we have a sewer that starts over on the other side. There’s a manhole that you can’t see. So, we have all these assets that we need to be collected, and our traditional workflow is to use GPS where we can. Outside of that, we go into our other tools to find an alternative.
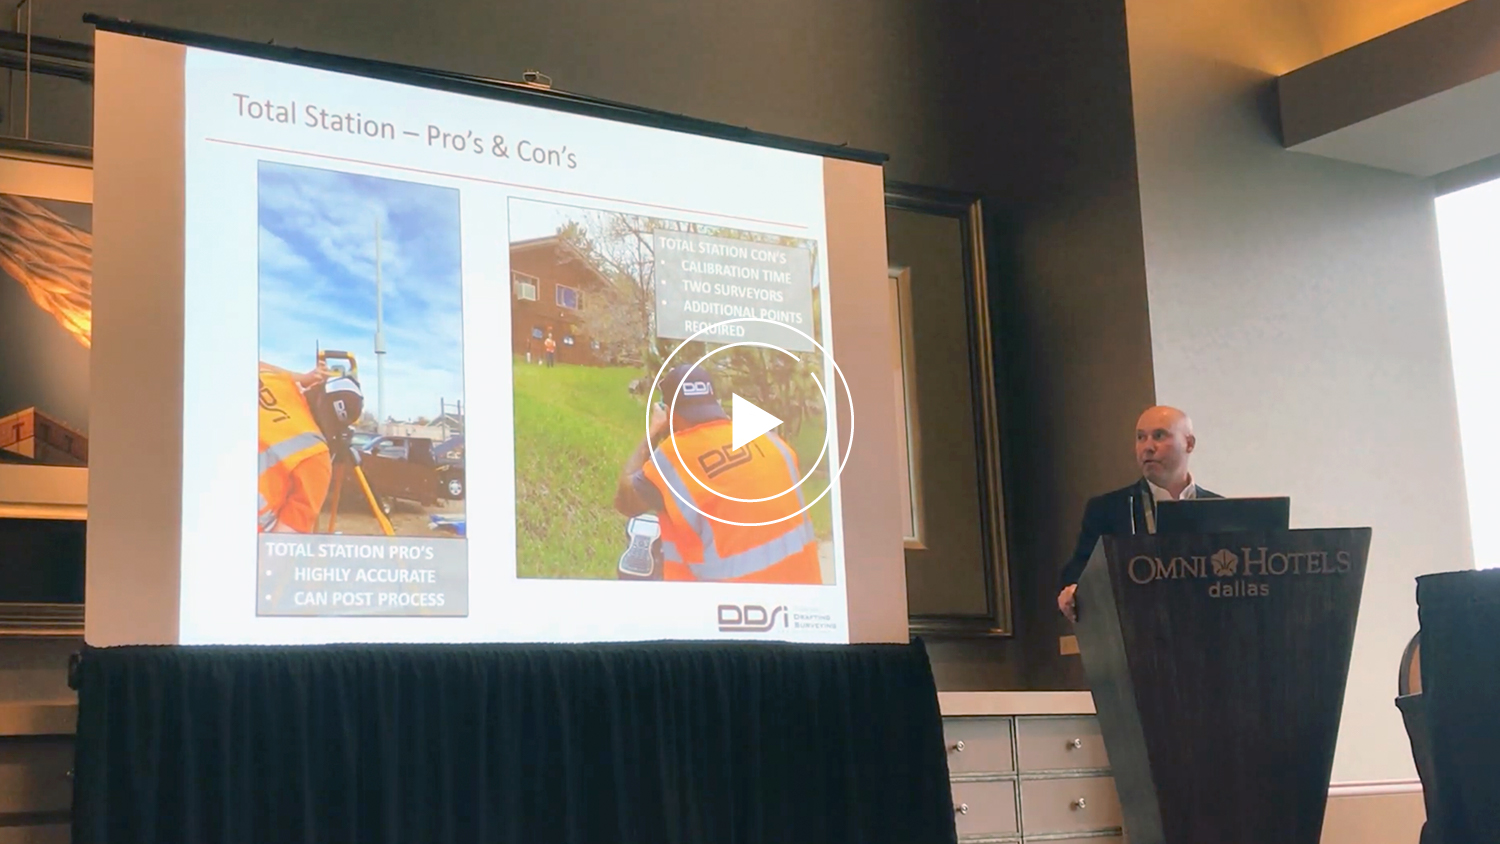
Legacy Solution: Total station, very accurate but not very fast
The first way that we can solve this problem is by using a total station, that was our go-to tool, in our previous jobs. Total stations are great tools and they are many pros to them. They’re highly accurate – up to a millimeter accuracy — and we can use them essentially in almost every situation where we can’t get a GPS signal. [Moreover,] we can post-process the data, giving us some feedback on what we’ve gotten and how accurate it is.
The cons to them are long calibration time (the amount of time it takes the crews to get set up and then calibrated requires both the field guys). Amount of operators (we have a two-man crew so both people have to be used to operate it0. And then we’ll have to collect additional control points in order to offset the data, so you have to have a backsight-checkpoint, which has to be essentially monumented. Also, you have to get a fixed GPS signal for 180 seconds in order to tie it down, and it takes a lot of time. Over on the left, is the monopole. We used the total station for this scenario to get an accurate elevation of the tower itself. Taking that same piece of equipment and then traversing over to the next spot and resetting it up takes a lot of time.
I’ve been trying to figure out a way to make the whole process move faster.
New solution: Laser mapping with LTI laser rangefinder, Eos Arrow Gold and Esri ArcGIS Collector®
 So here you can see where we’ve got in, and we’re essentially going to be starting what we tested out and putting new technology to use on this job. We’ll do this with the new laser offset routine [a laser mapping solution for Collector on iOS released by Eos, Esri and LTI]. I’ve used this routine on some of my other jobs and it works out really good. It helps out especially if you’re using one spot to shoot many [assets]. This new routine works well with the new [LTI] laser that we’re using; we’re getting great accuracy out of it and we meet the thresholds that we need especially for utility locates. They paint from the ground up and you know one-foot swath for your fiber. So if we’re getting let’s say 1-inch inaccuracy that’s well beyond the threshold that we need to collect that asset. Boundary setting pins, range points, and other things like that won’t be used for a lot of the topo work that we need to do. This routine works out as a perfect tool. It also gives us two rovers instead of just one standard unit.
Using laser offsets for this project
You can see once again the density of all the locates there with the flags. You can also see the different equipment there. And then here is just essentially showing how this ties into Collector [for ArcGIS]. This is something new that we started to use this year, since [Eos, Esri and LTI] have been able to essentially tie in the offset routine directly into Collector now. So there’s no custom coding on my end or in the analyst’s work that is required to make this work.
We’re just using Collector right out of the box, where we can essentially get the basics built for what we need. We use the basemaps key as well; it gives the guys a lot more detail. It’s very easy for them to see where they can flip between the aerial imagery and that topo base map, which is pretty much the go-to standard. It allows the points to stand out.
Using VRS base station corrections
What I want to point out on this slide is our accuracy; it is tied into the VRS system we used earlier. We’re at the threshold of about 60 miles from the actual base station itself. At 60 miles we’re pushing the boundary for how far we can go out and still get accurate real-time corrections. So you can see that we were inside Collector to also bring up some real-quick heads-up feedback from the crews. They got one-inch accuracy on their horizontal, and got three-inch accuracy on the vertical. Once we did the actual offset, we were within one inch of doing the offset routine for that same feature.
So over on this side we’ve set the first checkpoint and then, on the red dot, was actually the second point. And that became our offset right there. We were under the canopy there for that first one.
Three workflows to pick from for laser mapping, and why they chose Range-Range
Before I go much further on that point there are three solutions that you can use for the offsets that are standard right now.
The first one is the Range-Azimuth, it is a single point routine, and this is where the azimuth bearing is taken directly from a TruPulse 360, which the device has that built into it. It’s a great tool, especially if you want to shoot something in the middle of the road. It is perfect if you need a manhole, water valve or something along those lines.
Another is the Range-Range triangulation. It is taking two points, and shooting to the same spot, the software does the math for you. Then you can use that to create the offset.
Finally, we have the Range-Azimuth-Backsight workflow, which is like a total station but with a slightly lighter setup. You still have to set up a backsight, do a little calibration to the unit, and it’s ready. So for this project, the Range-Range solution works the best because the crews can just keep moving. You can keep moving from point to point; you don’t have to reset to set up a new backsight. Essentially that’s the most accurate of the three routines that we could use to get the imports with the least amount of variables.
Using the range-range laser mapping workflow
So here’s just a real brief example of how we’re using the Range-Range to get those same points. Once you acquire your first location, this is the first location in Collector. At that point, it now gives you the choice to offset from that same location, and that’s essentially it. So we go to offset, and from there we choose our first point. Then you can see how we triangulated over to that one spot, since those are the two points that we want to be occupied. And then from there it switches over to the Eos Tools Pro interface, where the actual offset math is done outside of Collector. So we essentially go back into there, do the two checkpoints from either side. And once you’ve got those two points occupied and you’ve shot your offset, it then gives you the choice of which of the two points [is your true point]. So in this case you choose between the east or west side of the triangulation. Which one was your point? So you can kind of see there, at the top, that down here in the lower side, those were the three flags. So we just shot the flags as our point, and to kind of call it out made it easy. They don’t always set flags, but they did this time and it turned out to be a big help, because they were really accurate. You can see that it’s the same width. So this workflow worked out to be a perfect routine for that offset.
Added benefit 1: Mapping four utilities attached to the side of a building without multipath error
 The other scenario that we encountered on this project was for utilities attached to the side of the building. This scenario also traditionally gives us problems when we’re out in the field and attempting to capture utilities quickly.
Once again, we would either set up a total station and stand over there to shoot each one of those points and move on to the next. But with the new laser-mapping system in Collector, we’re able to shoot all three of them at one go. We also avoid the other issue that we normally encounter, which is multipath errors (signal interference from obstructions). We do some small cells as well, and if we’re sticking to the routine of pulling up next to the utility pool itself, you’d notice some problems where we get multipath errors. This means the points show up where they’re not supposed to. And there’s not a whole lot of Quality Control tools in the field for us to use and detect these errors, so that the guys could say, “Hey look at this, right? We need to shoot it again.” These guys are trying to go as fast as possible and be as accurate as they can to get the job done efficiently.
Added benefit 2: No more taping
For this scenario, the other way that we solved this problem was that we taped in the building. We took our field notes with a field sketch and manually taped off the building. We measured the outer corners and from there started to measure in assets inside. When that document gets scanned, it goes into the project folder while the rest of the data is passed to the drafting team. The drafting team deciphers it. They put it into drawing, and that obviously takes a lot of time. The drafting team likes to work with point-lines right out of the box, and taping makes it easier for them. However, taping in is something we use as a plan-b when we have to. But if we don’t have to essentially walk around the building and do all those manual measurements, then the new routine is a big help.
So from there, those are the same screenshots from collecting that exact asset, so you’re doing the same routine. You start off by inputting your point in Collector, move over to the offset routine inside of Eos Tools Pro, and you get those circles to give you the idea of where the triangulation landed at.
Added benefit 3: Real-time, in-field quality control
I want to point out that there was a lot of vegetation on that side as well. The person that I was working with that said, “Hey this one didn’t land on the side of the building”. He was shooting through the side of a bush, since that was our only other angle, and he picked up right away that the point didn’t land right where it should have. So you can see what I mean there, it’s almost right on. Of course, this is not our imagery; it’s coming down from both Esri and Google. And the point, still from the third-party app, still shows up within the same spot, so you can see our offsets there. So he knew right away whether or not it was right or not. This saves time because if we found out later, we’d have to have figure out another way to solve that problem that would take more time.
You can see the other points that we shot. Those are the three utilities that are coming over to the side, so it really helped us out quite a bit.
Pushing data to the cloud with ArcGIS Online and making it available for others to use with ArcGIS Pro, ArcMap, FG Databases, MS Access and other applications
From there we push the data up to the cloud. We’re using ArcGIS Online to store that; we have it hosted there just for efficiency. We have our project data from that point, and from there, we can directly import it into ArcGIS Pro or from ArcMap. So within our portal, we take those same points as they’re saved, and pull them back in. We can ETL it out of there with the different data types that we need. We use FG Databases, shapefiles, CSVs, and MS Access formats. All that can then be directly downloaded. That’s something that I don’t have to do for them. I mean, anything that I can do to stop people from asking me to download or create a shapefile for them is a huge help for me. Any of that stuff that they can do for themselves, in whatever format, is essentially just a right-click or download away. It is a huge help. So from there, we can bring the drawing back right into Pro. In this case, we’re looking at the almost the finished product.
Delivering the final product
So what we’ve got is our boundary in red; it’s the locked-in boundary from the traditional survey. We’ve got our one-foot contours that we brought in from the drone, which is overlaid with the utility locates that we have along the west side of the project. On the north side, you can see the density there, and all those running into the compound itself. The high-resolution imagery that we captured from the drone is here as well. So this gives a great reference and deliverable for the client. They can use it to do some designs if they wish to. Because they’re working off open source, they use free sources of data for their imagery, and we make sure what we deliver to them has that feature as well. That way they can easily pull the data into the programs they’re using for design.
Here’s a blow-up of that same area: You can see that pretty much everything lines up tightly. We have our easements drawn in; we have the new access and utility easements that they’re going to use to access the property. The goal is to figure out where we’re going to pull more fiber. The clients want to have more bandwidth. Where are they going to pull that from? What’s the best location to do that? If they’re going to bore, which side are they going to go from? They have to go from the utilities on the south side or over here at the northeast corner. There are actually four different pedestals in this project. You’ve got one in the north, one in the middle, and another electrical box in the far northwest corner that is pretty dense, with the utilities that are coming in there. Having the data line up in this format is extremely helpful. It’s all drag-and-drop, brought in from the format that it was originally put in. Once it’s been processed, outside of doing the imagery, everything else was drag-and-drop.
We finally get to our deliverable, so this is one page of the four-page document that we deliver. This is the site detail; they need to check the box in order to get the project to be accepted. So we normally have a parent parcel that just describes right away where we’ve tied what down. It describes where things begin and end on the property. When we write the legal descriptions for the lease areas and the utility and access easements, they’re really accurate and we don’t get a lot of pushback from the local governments, architecture and engineering groups that we have to submit these to. They go through the title commitment and any other easements that were in play on the property. Those are also shown on here.
More about VRS base station corrections
This is the next day at another site and now we’re back within our core, our VRS bubble. I’d say we’re probably only about maybe 5 to 10 miles away from the base station. I’ve been trying to test this out, trying to get this traditional survey, because we’re only pretty much using one platform since I’ve been on board in data collection. So I’m trying to integrate it and give us another platform to work with. I’m testing this new platform and seeing the thresholds I can get. So in this scenario, I’m down to 0.3 inches horizontal and 0.5 inches vertical. And then here’s a screenshot from Eos Tools Pro showing the coverage that we can get.
Using Eos Tools Pro to check satellites
We’ve got so many more satellites that we’re hitting this with. It’s just giving us a ton more base data to work with, and we’re tying in our receiver to be even more accurate. So to do the math on that road, really briefly, we’re at 0.7 centimeters horizontal and 1.2 centimeters vertical. This is all real-time and free without coding. I just punched in the data then went out and started running it. Using openly facings reference action is excellent because if you have any organization to use or pay for the subscription, it can easily be tied in here as well.
Tips and tricks for using laser mapping in Collector with Eos Arrow GNSS receivers and LTI laser rangefinders
What I want to show you on this slide are little tips and tricks. Some of them are explained below. There’s a toolbox that you can essentially download and bring into Pro to give you a little bit more metadata to import into your shots. So not only will we collect the GNSS fields automatically when it comes in, but we can also collect the offset metadata as well. That goes right into your fields. All I did was create my featured class layer, run the script, and in there with my essential base fields then push it up to our ArcGIS Online, which added it to my map. I then turned on the Collector for the iPad, and I was up and running.
It was that easy.
So no custom coding on my side. Again, I’m always looking for a way to avoid it. Even though we just had a presentation on Python, I try to stay away from as much custom coding as I can. I can point you to this later if you’re interested, but it’s just another way to get some additional metadata for some checks and balances.
Tips related to GNSS trends
So I’m going to touch on this briefly: I’m by no means an expert on all the trends. But for where I see things are going in this field — at least for data collection and mobile apps — the days of having a single device while sitting on your desk, meant only for office use, are gradually phasing out. I have a slew of different collection devices from the handhelds to the GPS. I focused on these because I’ve observed that guys in the field, including us, want to use what they already have in their pockets. Or they want to use something that could be cross-platform, that can be used for multiple solutions in the field.
Tips for choosing iPad (or Android) as a data collector
We use an iPad as our data collector. It runs our drone and does our flight paths. We’re able to send the data and sync it all from the same device, and we can even switch over to an Android device. If you want to do the same thing you did the previous day the next day, without having to switch gears, reload data dictionaries.
Tips for managing equipment maintenance
A lot of the manual maintenance that we have going on with some of our survey equipment can be a burden. It’s a time suck for sure. So the mobile apps pretty much [help].
Tips for using LTI laser rangefinders, drones and sensors at low cost with high accuracy
The laser rangefinders have three different versions that we’ve been using, and they’re getting more accurate for lower prices, which is what we’re looking for. On the UAV side, there are better sensors now with lower prices as well. We can incorporate multiple sensors on the same platform and I’m looking forward to that. The lowest price point as possible is the best for us — because we can get as many birds as we can to share out with our field crews, and they can collect as much data as possible with a single path. I hope that the price would come down to where it’s affordable for everyone soon.
Tips for GIS data sharing and accessing free data from official sources
On the GIS side, there is approved map sharing and data sharing. So, as the presenter before me was talking about with the county governments, I see that as coming in next the open-data side from the data holders. I think it’s going to become a little bit more accessible, and that’s something we have to do on our end. That is, instead of surveying all the time, we should track down free data when it’s available. We should find out what’s available from our local governments, from counties cities, municipalities, and towns. Get what they have, if they don’t have anything, we have to find a third party and use it to at least start our base mapping and get the project rolling.
Open data portals are something massive that he has opened our eyes to. It is definitely something important which a prior presenter talked about. I came from the local government side, were holding your data tightly was the key to the operational structure. I think that that’s going away now. I also think that the more it goes away, the more they find a better use for that data. And since there are contractors, such as ourselves, why not have their base data to work for them instead of creating it from scratch?
Summary
So just a quick recap:
- Time is money: With our projects, we have tight budgets, especially for the telecom side. In those type of projects, there’s a very little room for error, very short window to get the job done, and so it must be right the first time. Going for a second run is essentially a bust. If you can’t get the job on the first day, it’s not going to work.
- Equip the crew well: We don’t know what tool is going to be necessary to begin work on site. There’s no prerequisite and scope of the scene to get an idea of what we’re going to use when we get there. So we have to figure it out on the fly. Having team members that are problem solvers is key, hand-holding and lots of office calls that also slows down the process. The team members should be able to figure stuff out on their own and keep moving. The real challenge is the field.
- Bring your own device: We are able to put take these platforms on different devices that we have whether it’s our own phones that we’re using or company-sponsored devices that that work across all the different platforms. We use RTK laser mapping because it is now essentially at a price point and a usability level that’s getting sub-centimeter accuracy at least for horizontal; that’s a huge help for us. If you’re doing sub-meter and your threshold is within a foot, that’s not going to work but if you can get that same thing for around the same price from ours, it’s very usable.
- Be punctual: Try to get the deliverable submitted on time.
Tie all these things together to get to the right point as quickly as possible. That’s it.
You May Also Like One of These Success Stories

Customer Spotlight: Mike George takes on the latest technology
Meet our newest Customer Spotlight: Mike George of DDSI! Mike adopted laser offsets with Arrow & ArcGIS Collector, helping increase DDSI’s project margins by 20% per project!

Managing a construction site with UAVs, GNSS and web GIS
See how stakeholders in Texas benefitted from real-time UAV data captured and shared using ArcGIS Drone2Map, ArcGIS Online, and Eos GNSS receivers.