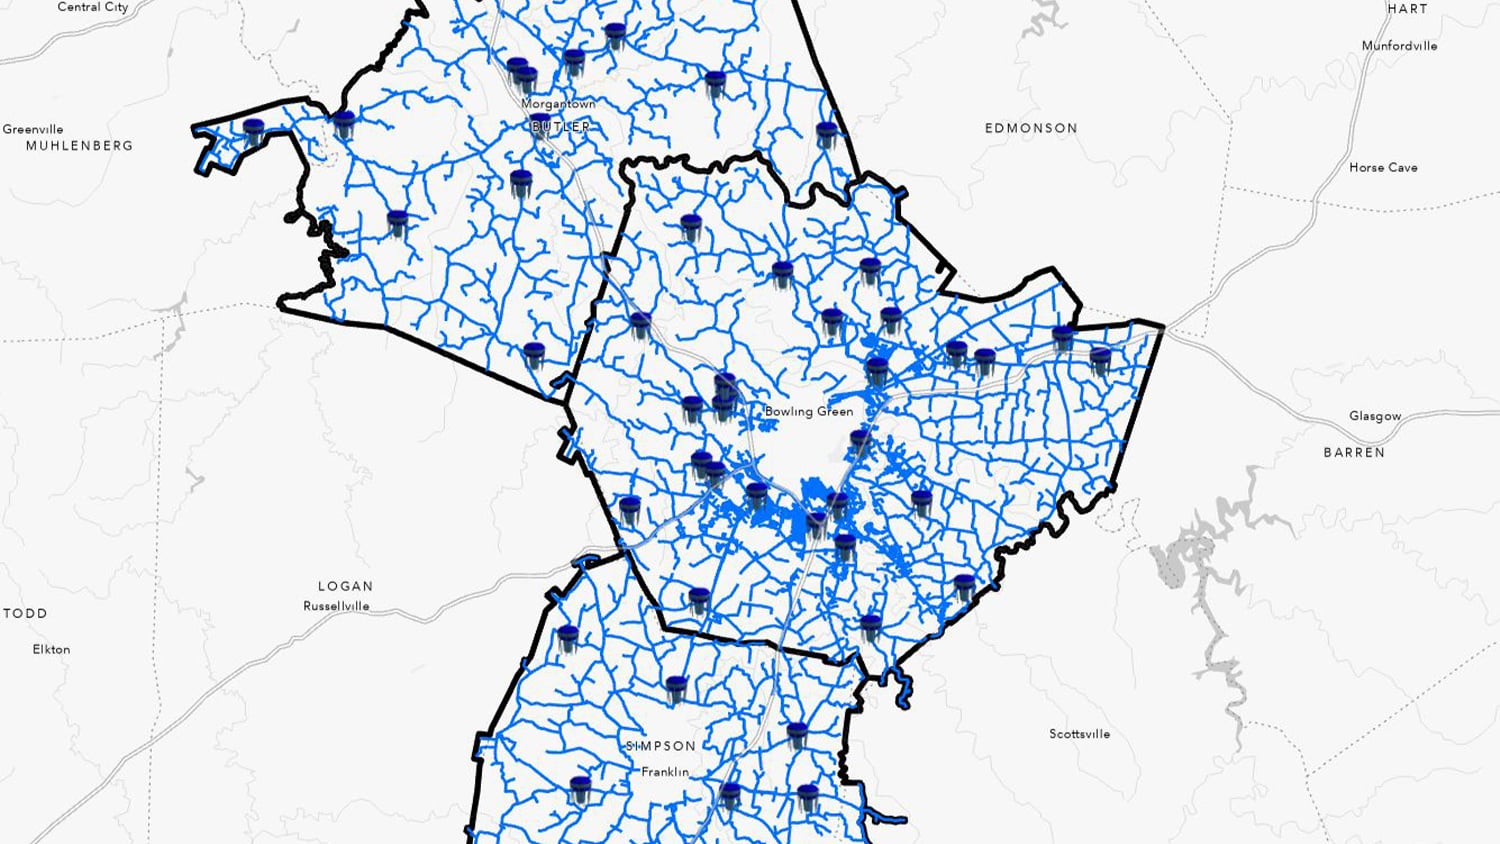
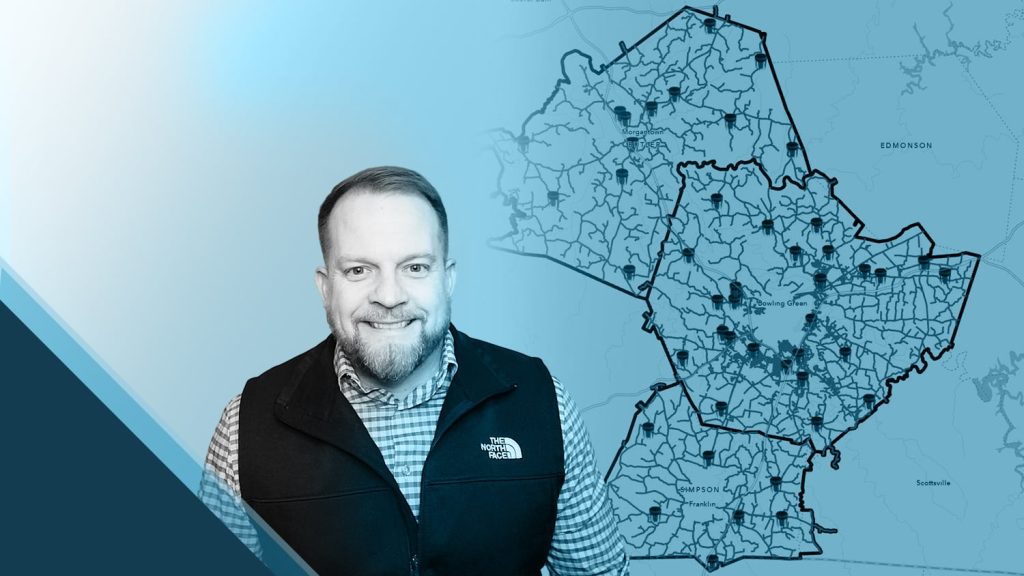
Southcentral Kentucky-based Warren County Water District offers water and wastewater services over a 530-square-mile area between Nashville and Louisville. Every day, the utility delivers over 8.1 million gallons of drinking water across 1,194 miles of water lines, while its wastewater system transports 2 million gallons of wastewater across 218 miles of sewer line. In addition to this system, Warren Water manages the water systems for Simpson County Water District and Butler County Water System through a joint operations agreement that brings the total length of water main to just over 2,100 miles across 1,200 square miles. Each of the three utilities has a separate board of directors, but today their operations are streamlined through one geographic information system (GIS) and one customer information system (CIS).
Video Recap:
Editor’s note: The written story was originally published by Esri Water in November 2022. It is republished here with permission. View the original article here.
The Original Move to a GIS
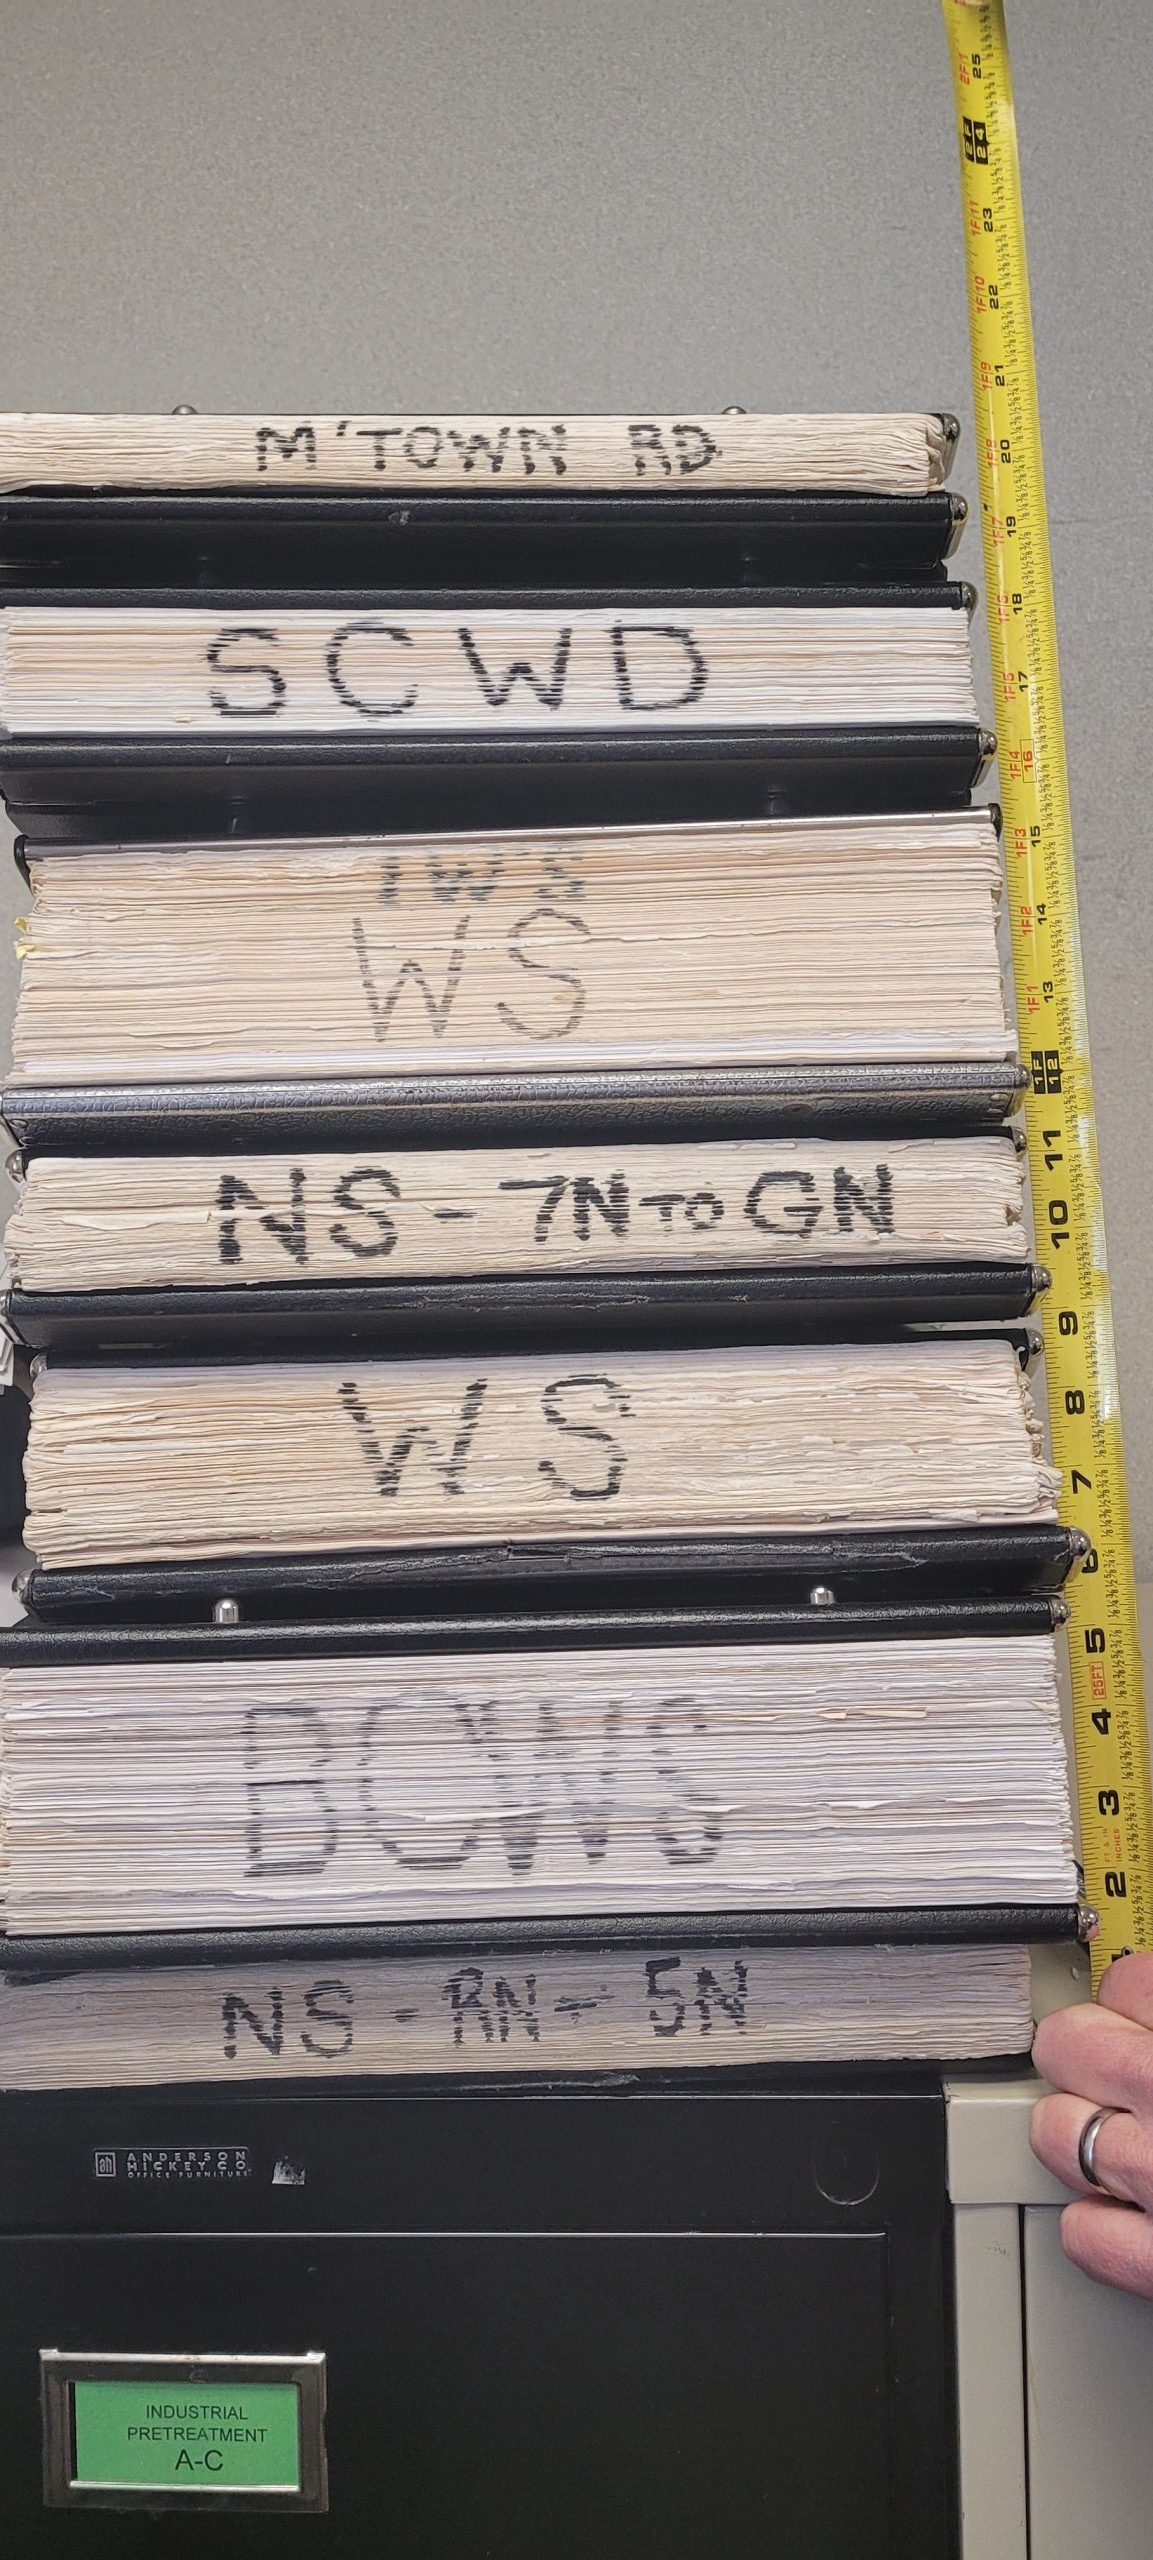
In the past, Warren Water used to equip its field crews with 75-pound paper map books to navigate to service order work sites. Although the map books got the job done, they were time-consuming to use—especially for new employees.
In 2006, Warren Water decided to modernize its operations and hired its first full-time GIS employee along with a contractor to kick-start digital mapping. First, Warren Water digitized and georeferenced thousands of paper as-builts into GIS features. The contractor then went to the field to map all the aboveground assets, using subfoot-grade mapping equipment. Once the locations were postprocessed, Warren Water IT and GIS manager B. J. Malone uploaded them into the GIS and snapped features to the new accurate locations. Malone and the contractor worked this way to map the Warren Water system and, subsequently, Malone brought field mapping in-house to map the Simpson County and Butler County systems.
“At that point, we had all of our aboveground assets—water and wastewater—mapped with subfoot accuracy,” Malone said.
The Challenge: Hydraulic Modeling for Wastewater Assets
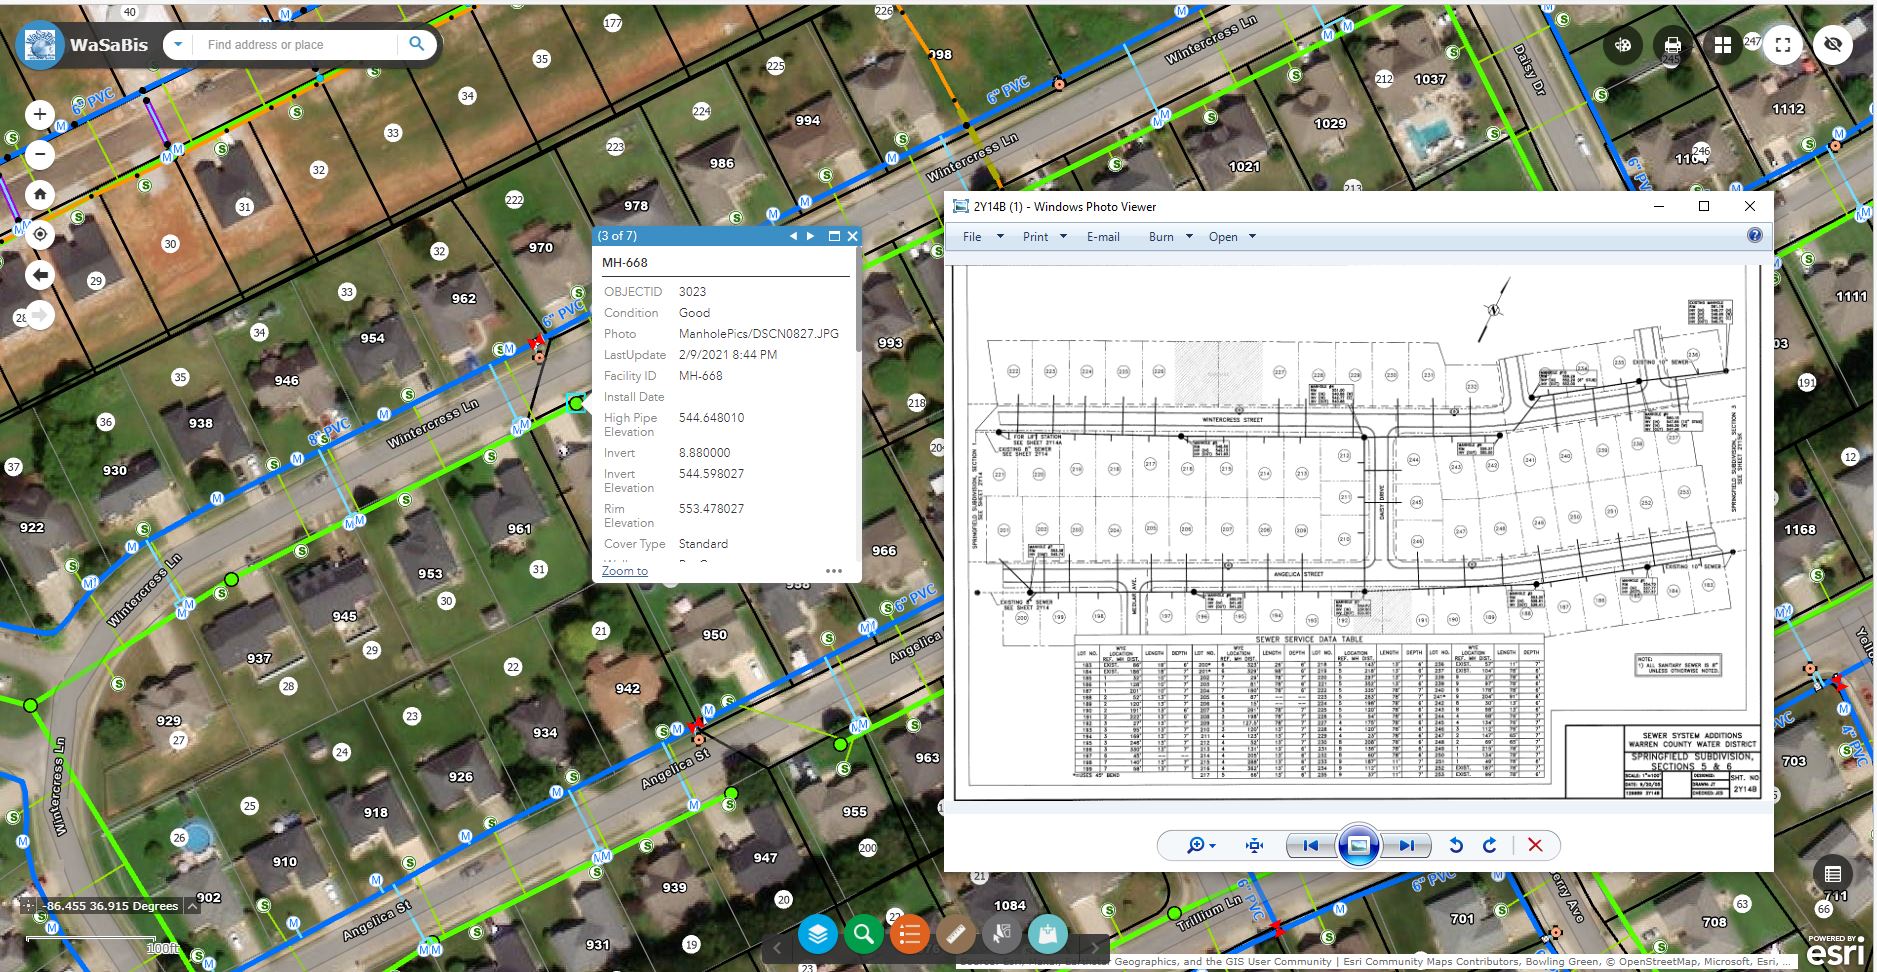
Subfoot asset accuracy was acceptable for mobile workers, but it was not good enough for the engineering team to use in hydraulic modeling. Hydraulic modeling relies on extremely accurate elevation values and would require centimeter-level accuracy in the GIS.
Extracting elevation values from paper as-builts was time-consuming and sometimes frustrating for Warren Water’s engineers. The drawings very often contained inaccurate slope measurements. Malone realized that Warren Water could benefit from improving the accuracy of its GIS data even further.
To test the idea, Malone hired another contractor, one who would remap the utility’s wastewater assets with centimeter-grade accuracy. In this pilot project, the collected data had to be postprocessed to obtain the desired accuracy, before being imported to update the GIS. But when these tasks were completed, Malone had the information at a level of quality that his engineers could use. His next challenge was to find a simpler way to maintain this level of accuracy in-house—and potentially expand it to all assets.
Additionally, in 2009 Warren Water had begun utilizing GIS data in the field with a Windows-based mapping application on laptops. While the laptops were a great tool, the mobility in the field was limited to the truck.
Malone believed the new in-house mobile mapping solution could overcome both of these remaining challenges.
The Solution: Real-Time, Accurate Mobile Data Collection with ArcGIS®
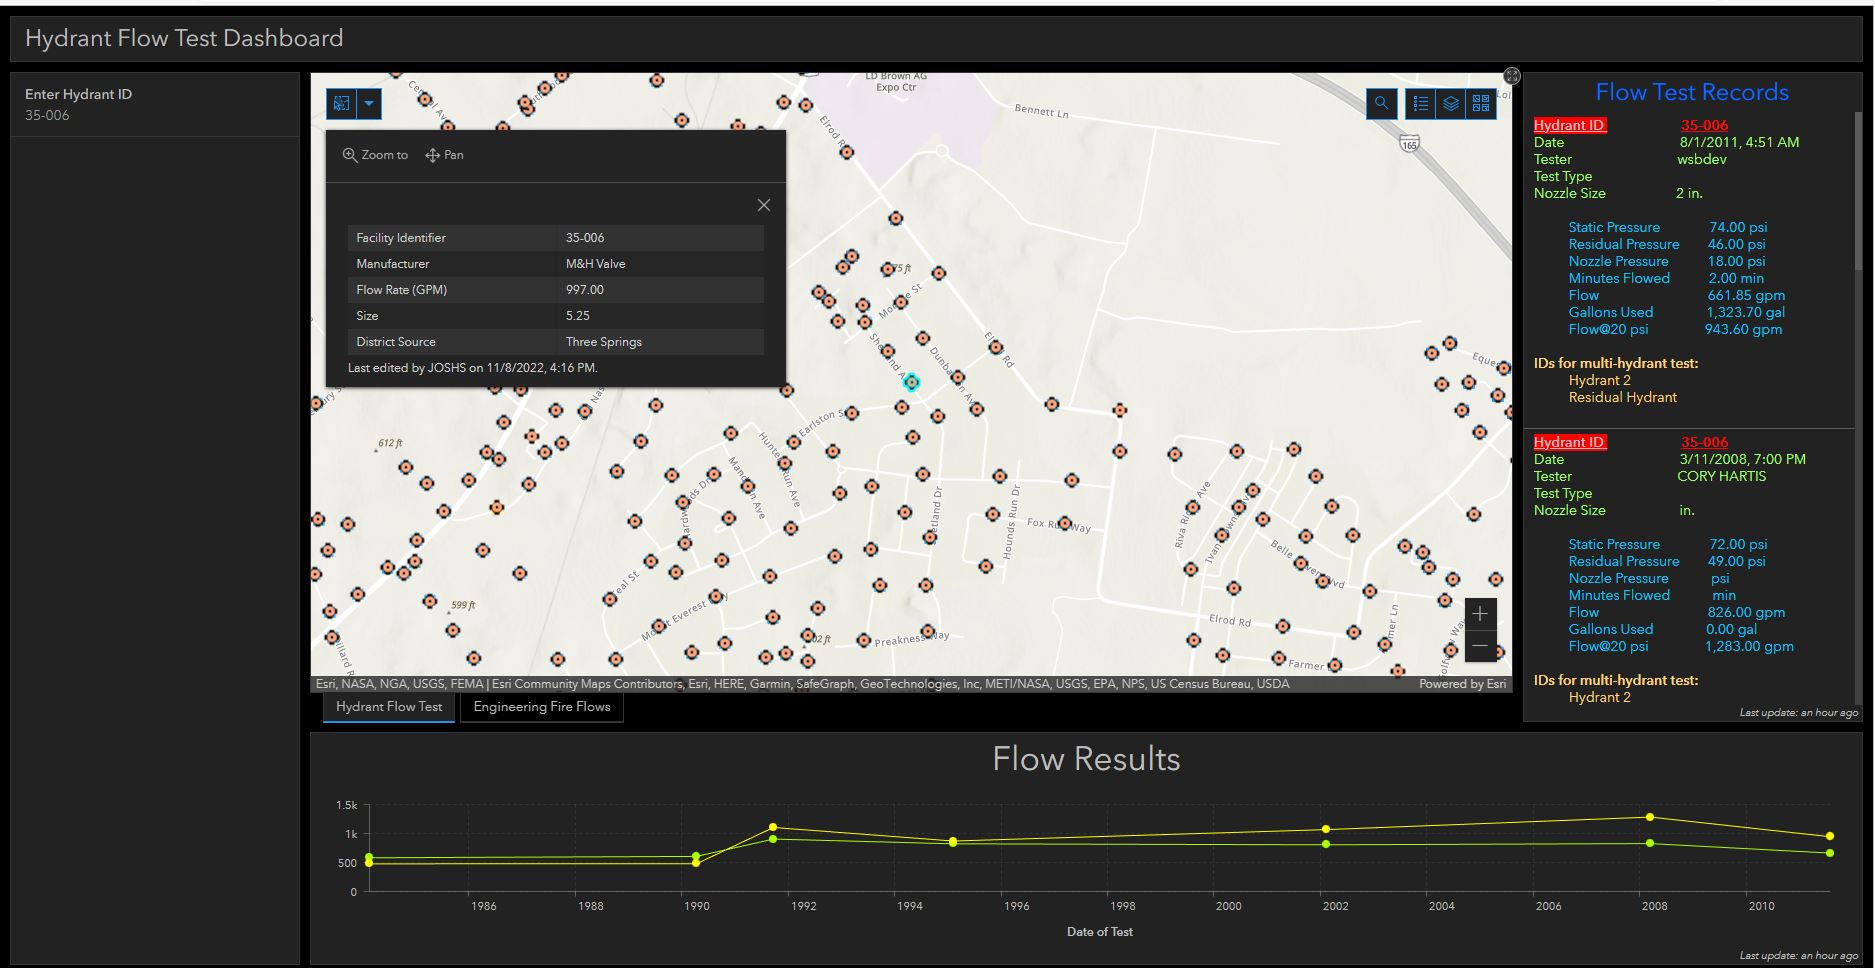
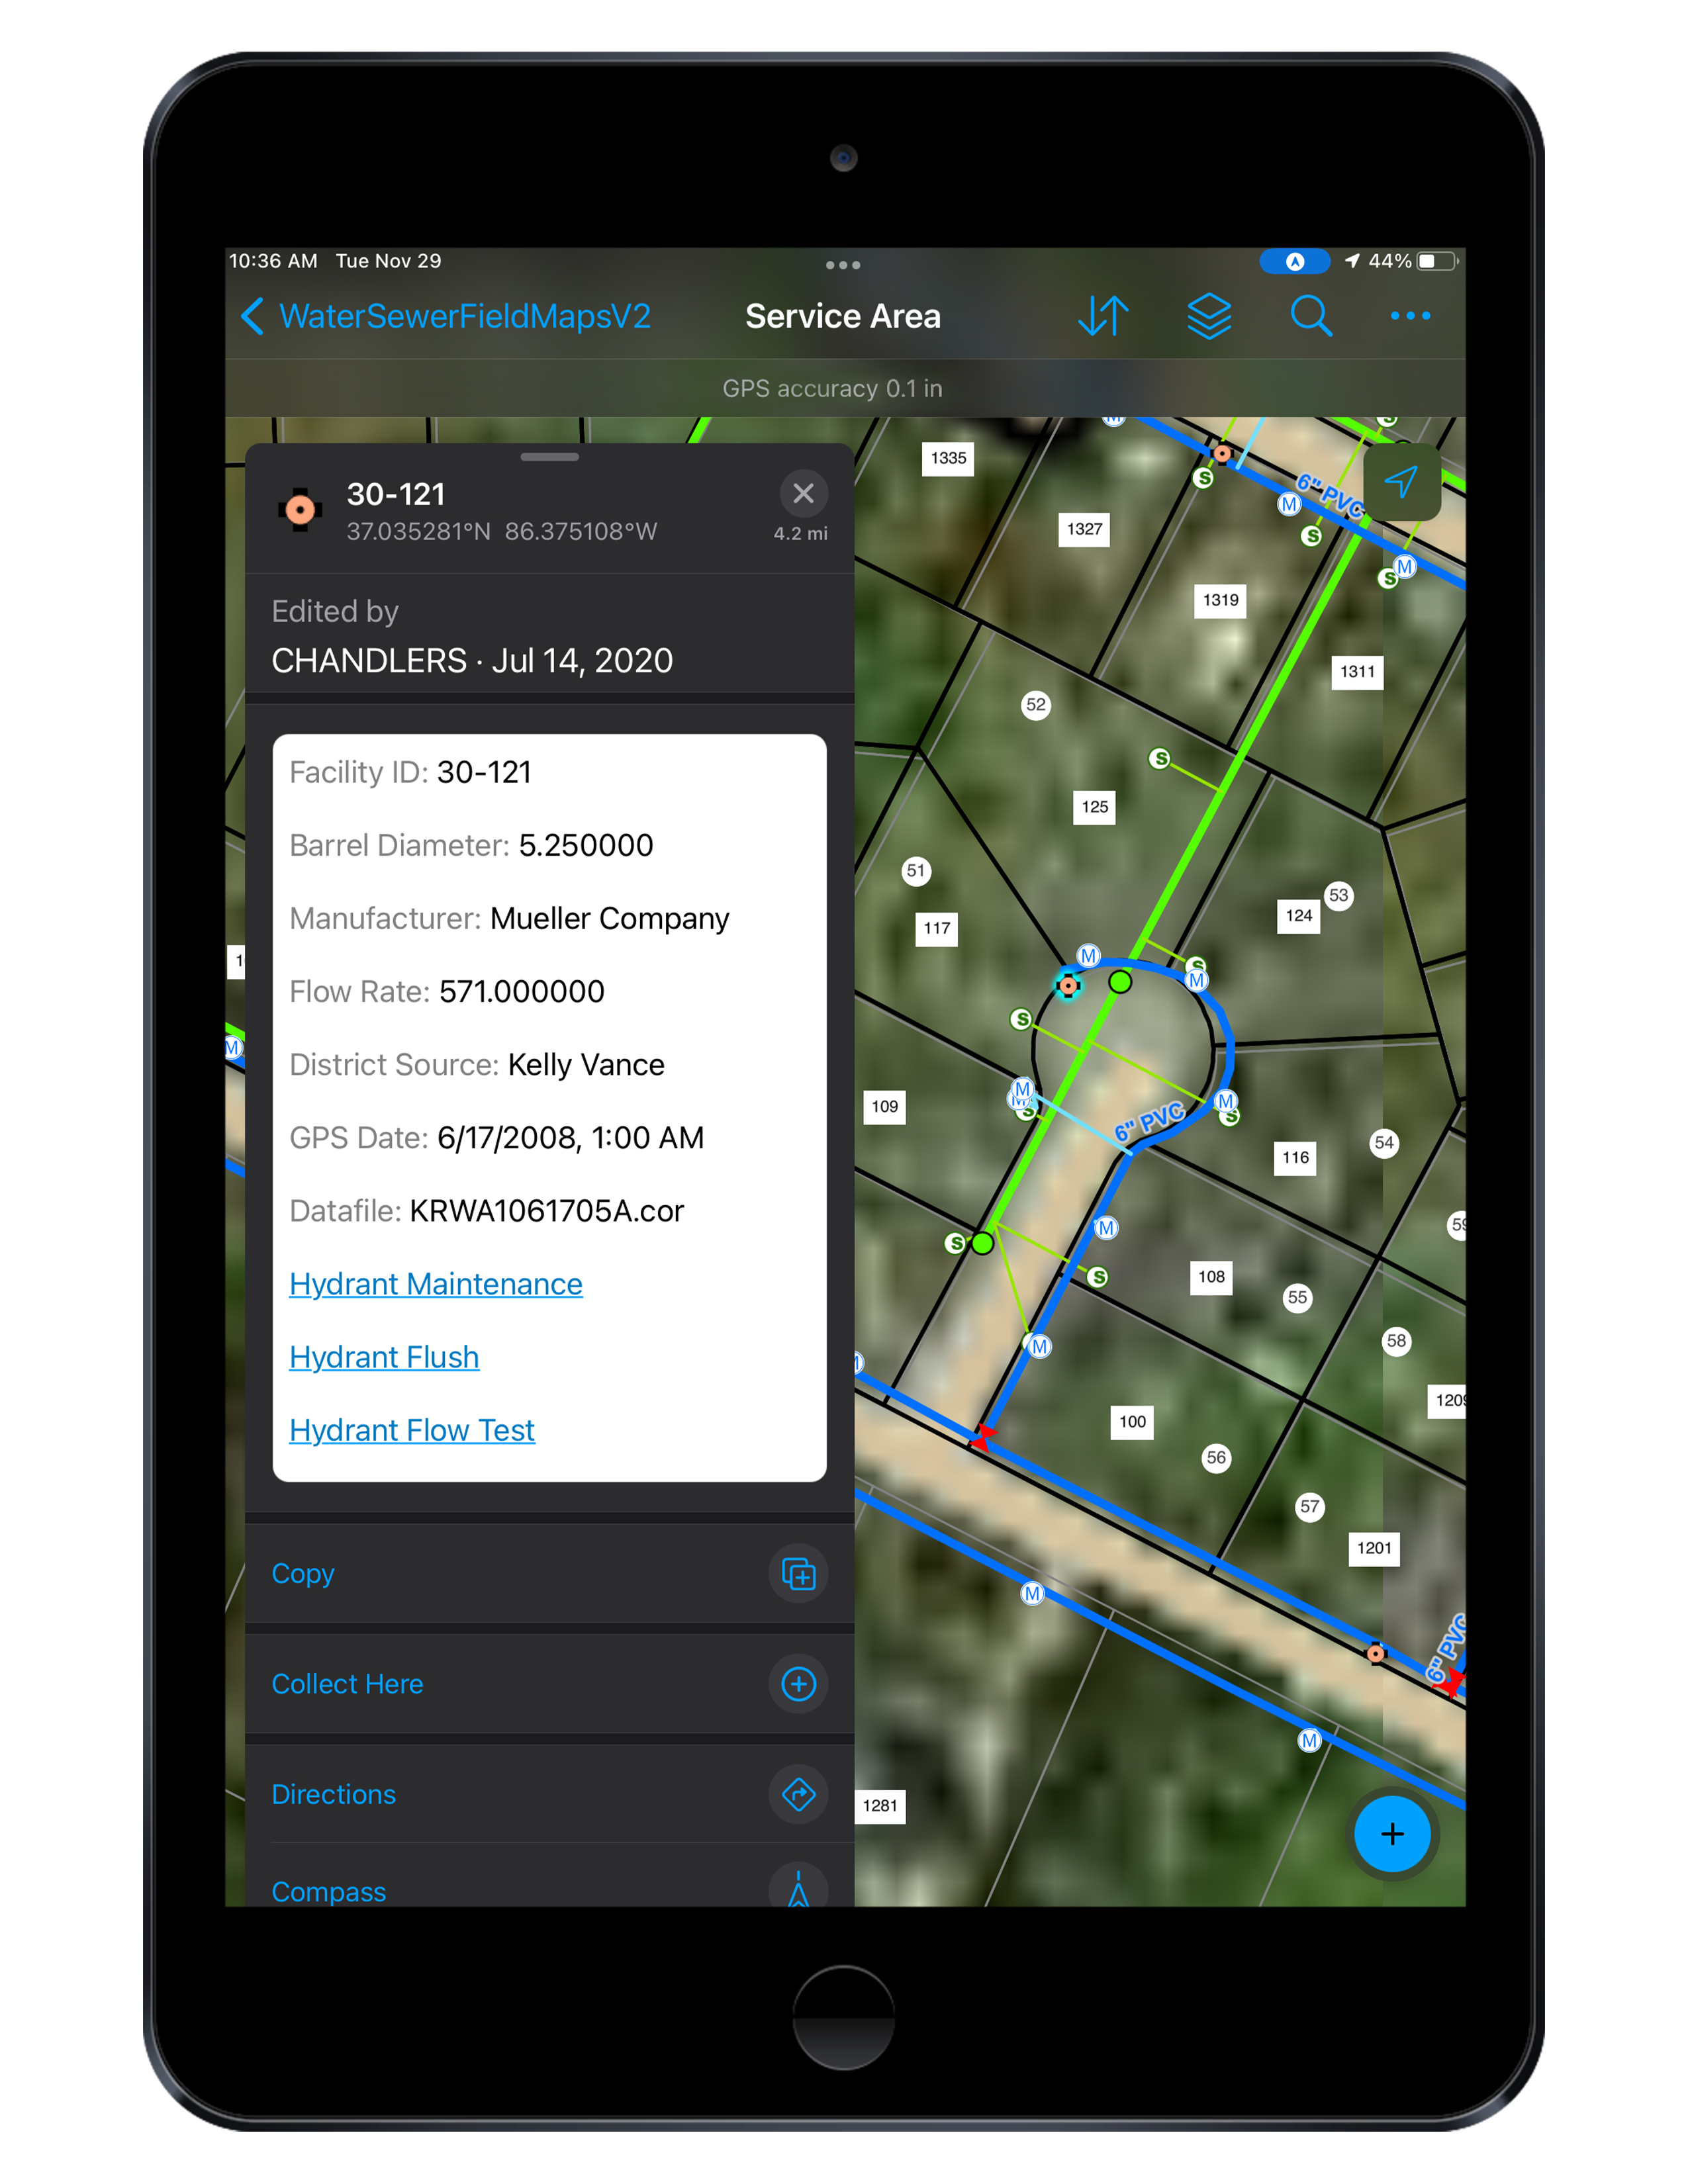
Around this time, Malone noticed Esri’s mobile data-collection apps were becoming not only very popular but also incredibly robust. ArcGIS Field Maps (previously ArcGIS Collector) and ArcGIS Survey123 could enable GPS-supported data collection directly to the GIS, in real time and with the data already in GIS format.
“We already had Esri software, so migrating to Esri mobile apps made sense to us,” Malone said. “Everything was native to the GIS format, and it enabled us to give our [staff] in the field something with GPS capabilities on a device they were comfortable using.”
The utility gave its field crews both iOS and Android tablets—based on user preference—running Esri apps.
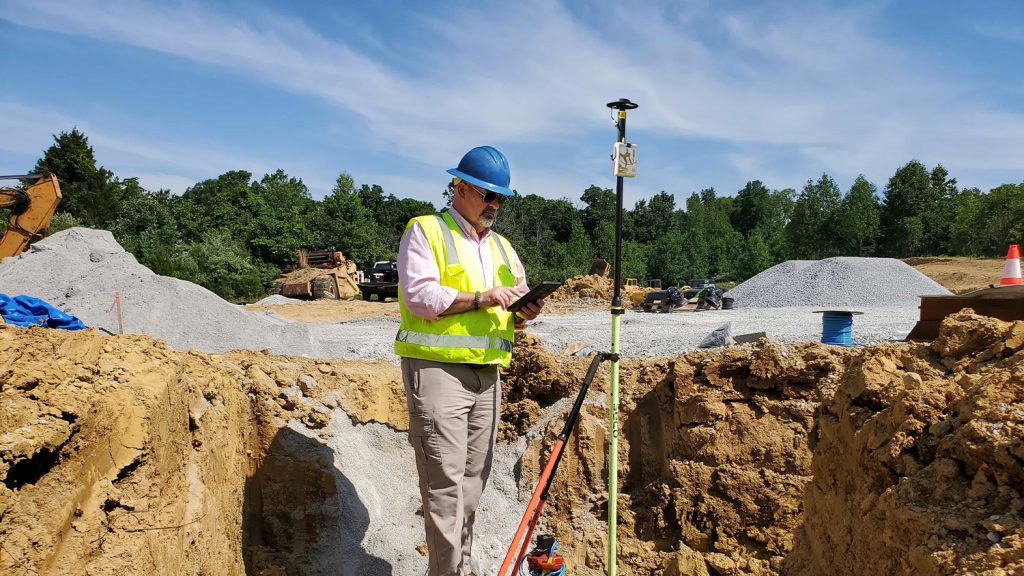
The last remaining component was a compatible, centimeter-grade Global Navigation Satellite System (GNSS) receiver that worked with the ArcGIS apps. After consulting with a nearby water district, Malone chose the Arrow Series GNSS receivers made by Esri Gold partner Eos Positioning Systems. The Arrow Gold® receiver provides real-time, centimeter-grade locations through a combination of GNSS positioning and real-time kinematic (RTK) differential correction processing. It could be used with the local free RTK network, Kentucky Real Time Reference Network. Going this route would eliminate both postprocessing and manual data uploads to the GIS.
“When Eos came along and made that marriage with Esri so that everything works natively in Esri apps, that became a huge time-saver for us with both data collection and postprocessing,” Warren Water GIS analyst Josh Smith said. “It streamlined both office and [mobile] workflows by keeping everything in one place and eliminating the need to pass data through multiple applications.”
The Arrow Gold receiver also offered a feature for maintaining survey-grade accuracy in remote areas where internet service via the cellular network was spotty.
“We went to some of the most remote areas of our system to test out the Arrow GNSS receiver, and it just worked,” Malone said.
The Results: Streamlined Data for Hydraulic Modeling
They are able to find things faster and can access what they need on one device. It has eased everybody’s mind.
Today, Warren Water has mapped its wastewater assets with centimeter-grade accuracy, and its aboveground assets—for all three systems—with subfoot accuracy. This year Warren Water staff have deployed RTK data collection for all newly constructed assets. Meanwhile, engineers have engaged a consultant who will now use the RTK elevations to develop a wastewater hydraulic model. The engineers are already using the data for other workflows, such as system-modification planning and historic leak tracking.
The field team members have also started to realize gains from having accurate, digital maps with them at all times.
Warren Water has since hired one more full-time GIS employee to support Malone. They estimate that out of all 74 employees at the utility, 65–70 use the GIS regularly.
The meter-reading team members use the maps to navigate to meters, and they’ve also aided Warren Water’s installation of 41,000 new smart meters. Meter data is stored with locations in the GIS and integrated to the CIS. Customer service representatives (CSRs), in turn, use the data to respond faster to customer inquiries, generate service orders for field crews, and respond to contractor requests for asset information in specific areas.
“We save a ton of time for our CSRs,” Malone said.
Another Unexpected Benefit: Maps Help Warren Keep Up with Requests to Locate Assets
The aboveground data has proved so valuable that Warren Water has started to also map its underground assets. Today, developers and inspectors are equipped with ArcGIS Field Maps and Arrow Gold receivers to map assets in new subdivisions before they are buried.
For call-before-you-dig requests to locate existing assets, Warren Water equipped its asset-locating teams with the same technology. The teams now use the maps of aboveground assets (e.g., valves, meters) to more quickly find buried water mains; in places where underground assets are already mapped, the teams navigate right to these assets. They still perform the traditional field validation, but the time savings have been huge. Malone estimates that demand for fiber-optic cable installation has caused locate calls to approximately quadruple in the past year alone.
“With the increased number of locate requests that we currently have, I don’t think we would have been able to keep up the pace without these maps,” Malone said. “It has really streamlined that process and helped us locate assets more quickly.”
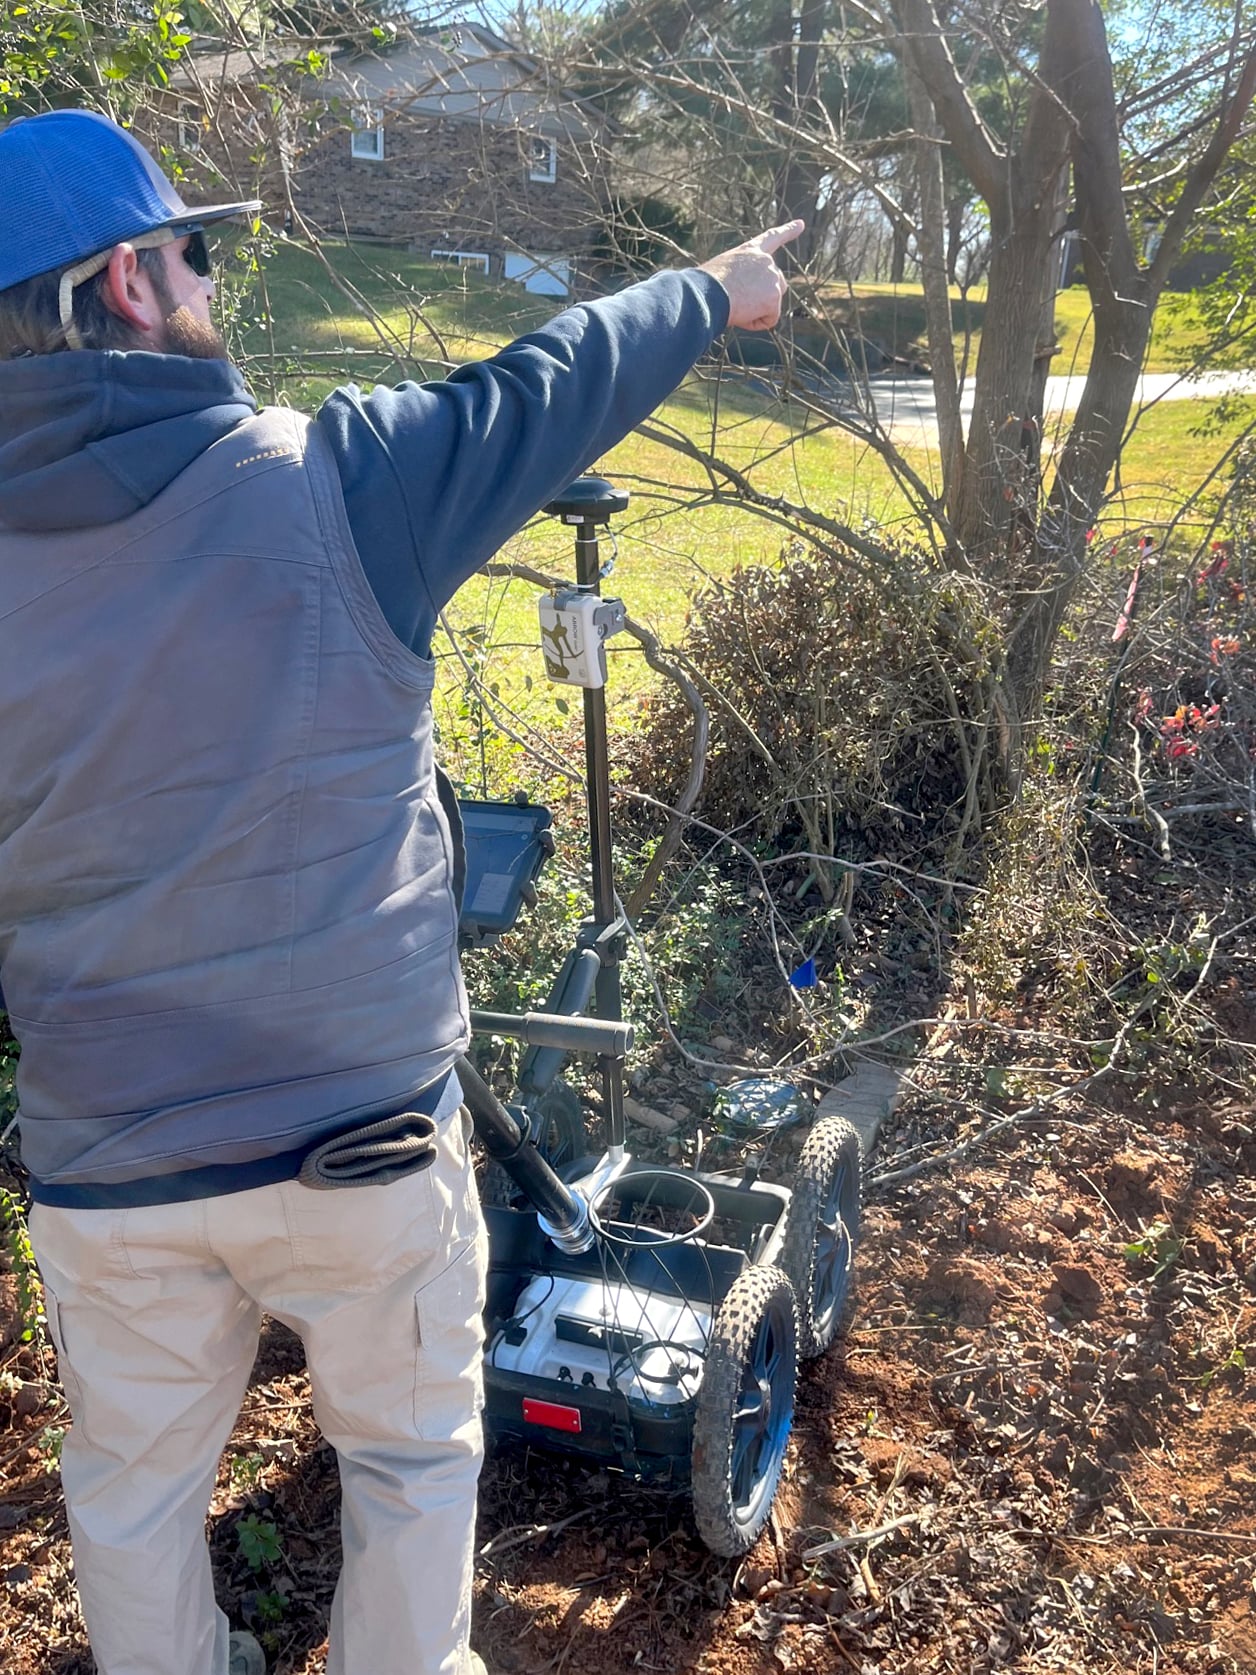
So far, Warren Water has mapped over 68,000 underground points across 51 miles of pipe. The utility has also purchased two ground-penetrating radar (GPR) devices and equipped them with ArcGIS Field Maps on Android and an Arrow Gold receiver. According to Warren Water operations supervisor Travis Watt, having the RTK capabilities of the Arrow Gold along with the GPR devices and Field Maps has been amazing.
“It provides my team with two methods to locate underground assets,” Watt said. “At times, [the team] can navigate nearly down the exact center of buried water mains.”
Malone says he is grateful that the utility’s employees and leadership see the value of the GIS.
We really try to be GIS-centric, to build the workflows and applications that enable us to make smarter decisions. When we added accurate locations into the GIS, that’s what really paid off for us. Now our field and office teams are realizing the efficiency gains, and we’re making their lives a little easier. That’s been a win.
Download a PDF of this article in ENGLISH.

